
⚡️$APLD’s Chart Is Talking — and I Like What It’s Saying
💡Daily Trade Idea – Monday Oct. 27, 2025 – $APLD Trade Setup and Technical Breakdown

Good morning traders and investors —
Today I’m looking at Applied Digital Corp ($APLD), a name that’s been catching renewed momentum lately after a quick pullback from the highs. This stock has been one of the stronger performers in the AI-data-center space, and the recent price action tells me it might be heating back up for another move. Let’s break it down.
📰 The Story Behind Applied Digital
APLD’s been carving out a pretty strong identity in the AI infrastructure arena — not just as another data-center company, but as one of the few with deep exposure to AI workloads and high-performance computing. They’ve been steadily scaling capacity and landing partnerships that put them on the radar for traders who want exposure to the picks-and-shovels side of AI.
Lately, online chatter has turned positive again. On X and Stocktwits, the sentiment has shifted from short-term profit-taking to anticipation of the next leg up — traders are watching how it holds above support. Implied volatility is still elevated (120% IV, 67% IV rank), which tells me there’s plenty of premium in the options chain to take advantage of.
📉 Technical Breakdown
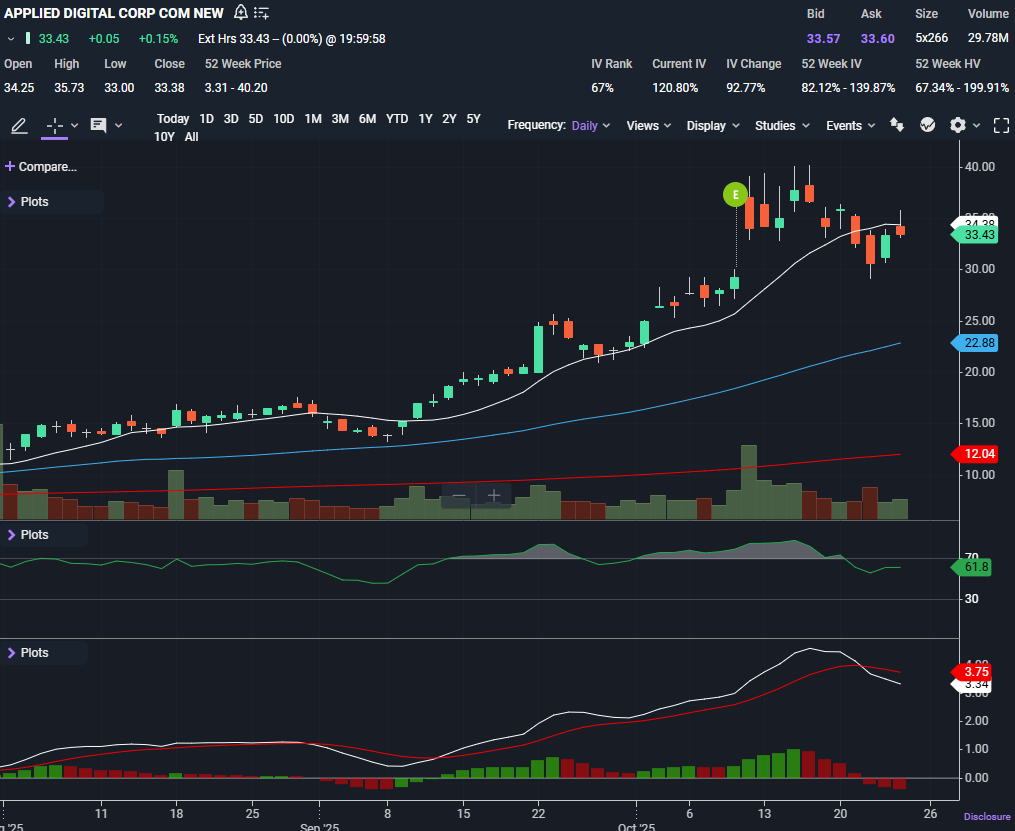
Friday’s close came in at $33.43, not far off the 10-day simple moving average ($34.38), with the 50-day down at $22.88 and the 200-day at $12.04. What I like here is the structure: after a strong rally that pushed above $40, the stock pulled back in a controlled way and is now finding its footing.
The most recent candles are starting to print higher lows — that’s early confirmation that buyers are stepping back in. The price is still sitting above both the 50-day and 200-day SMAs, which confirms the overall trend remains bullish. This kind of setup — short-term cooling within a long-term uptrend — is exactly where I like to sell premium.
Volume picked up on the bounce, suggesting there’s participation behind the move, not just random noise.
🔍 Indicators
RSI: 61 — That’s a healthy mid-range reading. Not overbought, not oversold. Momentum cooled slightly from the peak but remains comfortably in bullish territory.
MACD: The MACD line sits at 3.54 just under the signal at 3.75, and the histogram has been shrinking. That’s often what I see before a momentum shift — selling pressure fades, and buyers start reclaiming control.
💰 How I’m Trading It and My Take
Keep reading with a 7-day free trial
Subscribe to The Options Oracle to keep reading this post and get 7 days of free access to the full post archives.