
📊 Breaking Down AMAT: The Pullback, the Setup, the Trade
💡Daily Trade Idea – Monday, July 21, 2025

Hey everyone,
Let’s talk about $AMAT.
Applied Materials has been one of the leaders of the chip equipment group, and it’s been riding a strong trend higher since April. If you’ve been following semis this year, you know it’s been the place to be — and AMAT’s chart has looked like a textbook example of strength and momentum.
But now, after a big run, we’re starting to see a bit of cooling off. Not a breakdown — just a pause. And that’s where things get interesting.
So today, I’m breaking down the chart and giving you trade ideas based on what I see — whether you’re a short-term swing trader, a long-term investor, or looking to get a little creative with options. Let’s get into it.
📰 What’s the Story?
The stock has been on a steady march higher all summer, fueled by AI momentum, resilient earnings from the semi-cap group, and rising optimism around demand for chip equipment in 2025–2026.
With big names like $NVDA and $ASML stealing headlines recently, AMAT has been flying a little under the radar — and that’s usually when I like to get involved.
📉 Chart Breakdown
Let’s walk through the chart together and break down what’s really going on here.
📌 Price Action & Moving Averages
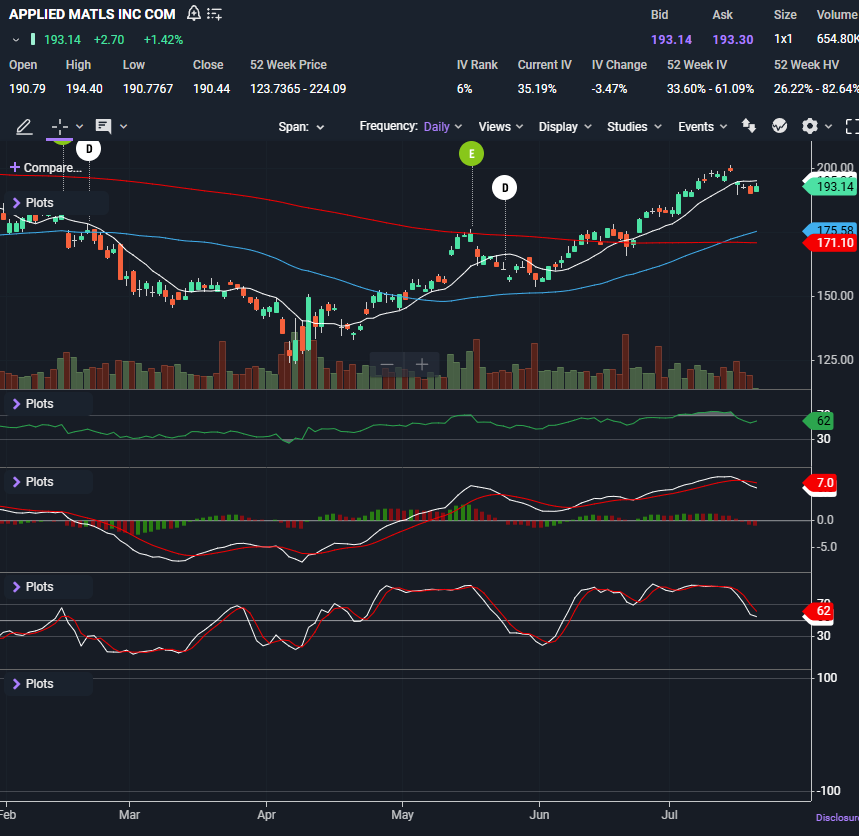
The stock is currently trading at $193.76, just off recent highs.
The 10-day SMA is still sloping higher and acting as short-term resistance— currently at $195.41.
The 50-day SMA is down around $171, and the 200-day SMA is further below at $141 — both showing a strong bullish structure.
After breaking above $180 last month, AMAT has formed a shallow base just under $200. If it clears that, we could see another leg up. So far, nothing broken. It’s a strong uptrend.
💪 RSI (Relative Strength Index)
Current RSI: 62
Still in bullish territory, but pulling back slightly from the 70+ area. That’s not necessarily bearish — in fact, a cool-off from overbought is often the setup for another push higher.
📉 MACD
MACD line is still above the signal line, but both are starting to roll over.
Momentum is slowing — not reversing yet, but it’s a heads-up that buyers are taking a breather.
🔄 Stochastics
Stochastics are dropping from overbought — currently reading 62.
Same story here: doesn’t scream sell, but it does suggest we’re in a short-term digestion phase.
🎯 Trade Setups & Strategy
Let’s talk trade ideas based on what I’m seeing.
