
🎯 Can Target Bounce Back After Wall Street’s Smackdown?
Saturday Deep Dive 8/23/25: Earnings held up, but leadership doubts are weighing heavy.

Hello traders and investors,
This weekend’s deep dive is on Target ($TGT). The stock’s been all over the headlines this week after Q2 earnings and the CEO news, and it just dropped hard. I’m adding it to my watchlist because the reaction here tells me the Street isn’t buying into the story yet — and that can create opportunity if you know how to trade it.
Let’s walk through the earnings, the new CEO wrinkle, and then line it up with the chart. I’ll show you what levels matter, how I’d approach it short-term, and how I’d think about it as a long-term investor.
What Just Happened
On the surface, Q2 wasn’t bad. EPS and revenue came in slightly better than expected, comps improved from Q1, and June/July looked stronger than May. Traffic and store trends picked up, digital stayed positive, and categories like trading cards (up ~70% YTD) were a real surprise growth driver. Target reaffirmed FY26 guidance, which was important after they cut last quarter.
So why did the stock tank?
Two words: leadership disappointment. The company announced longtime insider Michael Fiddelke (20+ years at TGT, currently COO) will replace Brian Cornell as CEO in February. Wall Street was hoping for an outsider — someone who’d shake things up in merchandising and fix years of execution issues. Instead, they got “more of the same.” That letdown, combined with no buybacks in Q2 (only dividends), had investors unloading shares.
Bottom line: better-than-feared results, but leadership optics killed the stock short-term.
The Chart Breakdown
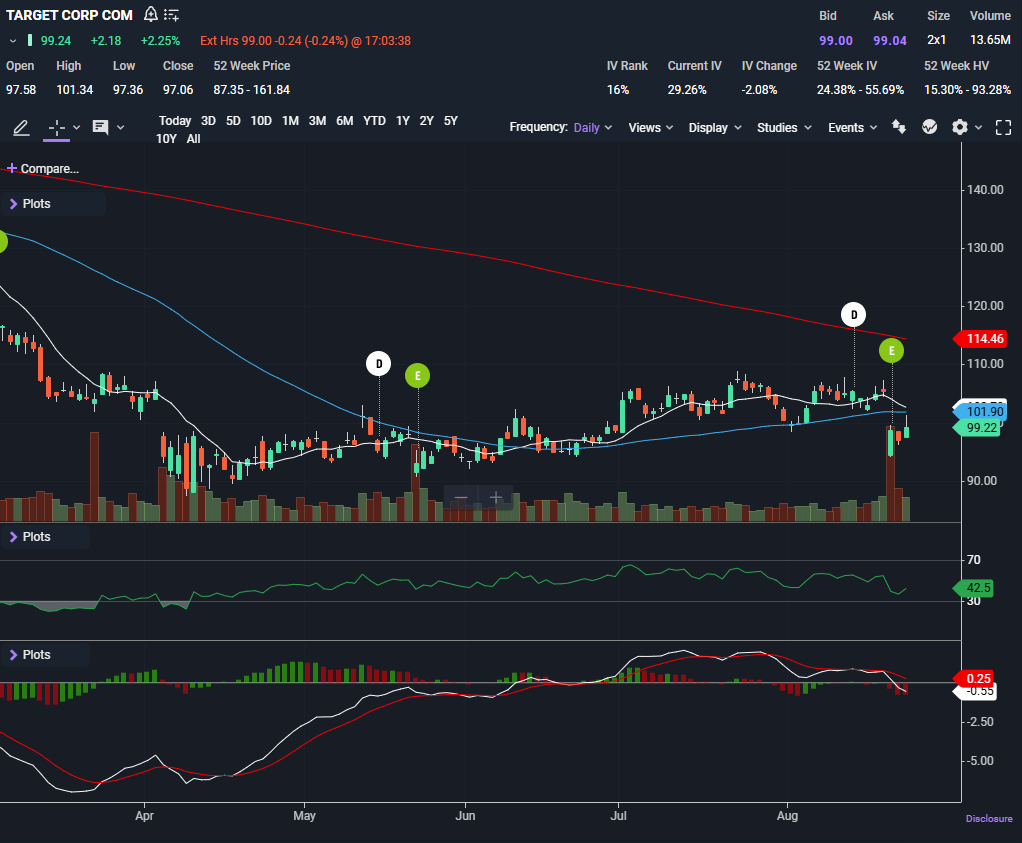
Here’s what stands out:
Price Action & Candles: Target cratered after earnings, dumping into the low 90s before bouncing back to close Friday at $99.22. Big red volume spike on the breakdown, then a rebound candle with lighter volume. That’s a damaged chart but not dead.
Moving Averages:
10-day SMA: $102.76 – Just overhead, now immediate resistance.
50-day SMA: $101.90 – Same zone as the 10-day, which makes this a tough wall to clear.
200-day SMA: $114.46 – Way up there, still the long-term battleground.
Patterns: Looks like a failed push into the 200-day earlier in August, followed by a nasty rug pull. Right now it’s in “repair mode” — needs to retake $101– $103 before bulls get any traction.
Indicators
RSI (42): Weak but not oversold. This lines up with the bounce attempt — there’s room for another leg down if resistance holds.
MACD (Bearish cross): Below zero and pointing down. Momentum still negative, even after Friday’s bounce.
Both indicators confirm this is still a weak tape with no strong buy signals yet.
Support & Resistance
Support:
$97.00 – Friday’s intraday low. Needs to hold or risk another slide.
$87.35 – 52-week low. That’s the “uh-oh” level if selling accelerates.
Resistance:
$101.90–102.76 – Confluence of 50-day and 10-day SMAs. Big ceiling now.
$114.46 – 200-day SMA. Long-term resistance.
