
🔥Candlestick Chart Patterns 📈
Finding Perfect Entry and Exit Points in Options Trading

Hello traders! 🌟 Today, I’m diving deep into candlestick chart patterns. Whether you're a seasoned options trader or just starting, understanding candlesticks can be a game-changer in identifying optimal entry and exit points by identifying trends and trend reversals. Let's explore how these powerful tools can sharpen your trading strategies and help you make informed decisions.
What Are Candlestick Chart Patterns?
Candlestick charts originated in Japan over 300 years ago and have become a staple in modern technical analysis. Each candlestick provides a visual representation of price movements within a specific time frame, revealing crucial information about market sentiment.
Anatomy of a Candlestick
A candlestick is composed of three main parts:
The Body: Represents the open and close prices.
The Wick (or Shadow): Extends from the body, indicating the highest and lowest prices during the time frame.
The Color: Typically, a green or white body signifies a bullish period (price went up), while a red or black body indicates a bearish period (price went down).
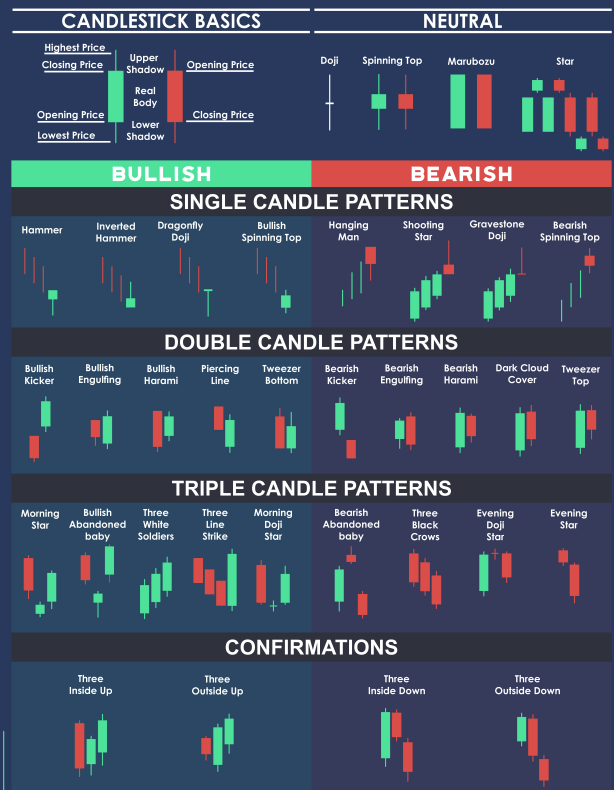

Key Candlestick Patterns to Know 🔑
1. Doji
A Doji forms when the opening and closing prices are virtually the same, indicating indecision in the market. This pattern can signal a potential reversal when it appears after a strong trend.
2. Hammer and Hanging Man
Hammer: A bullish reversal pattern that occurs at the bottom of a downtrend. It has a long lower wick and a small body.
Hanging Man: A bearish reversal pattern found at the top of an uptrend, also with a long lower wick and a small body.
3. Engulfing Patterns
Bullish Engulfing: A small bearish candle followed by a larger bullish candle that completely engulfs the previous candle. This pattern suggests a potential reversal to the upside.
Bearish Engulfing: A small bullish candle followed by a larger bearish candle that engulfs the previous candle, indicating a potential downside reversal.
4. Morning Star and Evening Star
Morning Star: A bullish reversal pattern that appears at the bottom of a downtrend, consisting of a bearish candle, a small-bodied candle, and a bullish candle.
Evening Star: A bearish reversal pattern at the top of an uptrend, featuring a bullish candle, a small-bodied candle, and a bearish candle.
Using Candlesticks to Identify Trades 🎯
Identifying Entry Points
Trend Confirmation: Look for candlestick patterns that confirm the prevailing trend. For instance, a Bullish Engulfing pattern in an uptrend can signal a continuation of the bullish move.
Support and Resistance Levels: Combine candlestick patterns with key support and resistance levels. A Hammer pattern forming at a support level can indicate a strong buying opportunity.
Volume Confirmation: Ensure the pattern is supported by volume. Higher volume adds credibility to the pattern, suggesting stronger market sentiment.
Timing Your Exits
Reversal Patterns: Pay attention to candlestick patterns that indicate potential reversals. An Evening Star at a resistance level may signal it's time to exit a long position.
Trailing Stops: Use trailing stops based on candlestick patterns to lock in profits. For example, adjust your stop-loss below the low of a significant bullish candle in an uptrend.
Divergence with Indicators: Look for divergences between candlestick patterns and technical indicators like RSI or MACD. A Bearish Engulfing pattern coupled with a bearish divergence can be a strong exit signal.
Practical Examples 📊
Example 1: Entering a Trade
Suppose XYZ stock is in a downtrend, and you spot a Hammer pattern forming at a key support level. The next candle is bullish, confirming the reversal. You decide to enter a long position, setting your stop-loss below the Hammer's low and targeting the next resistance level.
Example 2: Exiting a Trade
You're holding a long position in ABC stock, which has been in an uptrend. You notice a Bearish Engulfing pattern forming near a resistance level. The next day's candle confirms the reversal with a bearish close. You exit your position to lock in profits, avoiding potential downside.
My Take 🔍
Candlestick patterns are an invaluable tool in a trader's arsenal, providing insights into market psychology and potential price movements. By mastering these patterns, you can enhance your ability to pinpoint precise entry and exit points, ultimately improving your trading outcomes.
Remember, trading is as much an art as it is a science. Keep honing your skills, stay disciplined, and trust in the patterns to guide your decisions. If you have any questions or want to share your experiences with candlestick trading feel free to comment below! Happy trading! 🚀
Stay tuned for more insights and tips in my next edition. Until then, keep your charts clean and your trades green! -ec 🟢
*Disclaimer The information in The Options Oracle is my opinion, not financial advice.
Looking For More Trade Ideas? Follow Me on Twitter / X at EdwardCoronaUSA
This is great stuff. Can you recommend if you should be evaluating on a daily chart… 4 hr chart, 5 min chart ….. etc? When would we choose to use which chart
Running, blocking, and tackling! Sho nuff!