Charting SBUX: Brewing Opportunity or Further Decline?
Your weekend dose of technical analysis and trade ideas from The Options Oracle
What’s Brewing at Starbucks?
Happy Saturday, everyone! Grab your coffee (Starbucks, perhaps?) and settle in, because today I’m diving deep into a stock that’s been buzzing with headlines: Starbucks (SBUX). While the media focuses on union strikes and slowing growth, the real story lies in the chart—and it’s an excellent case study for those of us who love technical analysis.
The Drama Recap:
Union Strikes:
The Starbucks Workers Union staged a nationwide strike, initially predicted to impact over 300 stores. However, only about 60 stores temporarily closed, with 97-99% of locations continuing operations.Leadership Shift:
Starbucks’ new CEO, Laxman Narasimhan, is implementing a "Back to Starbucks" plan aimed at reinvigorating the brand after some challenging quarters.Demand Struggles:
Global comparable sales were down in Q4, particularly in China (down 14%), as macroeconomic headwinds weigh on the company’s performance.
These developments make for interesting headlines, but the real insights are in the chart, which is sitting at a pivotal level. Let’s dive in.
The Technical Breakdown: Starbucks’ Stock at a Crossroads
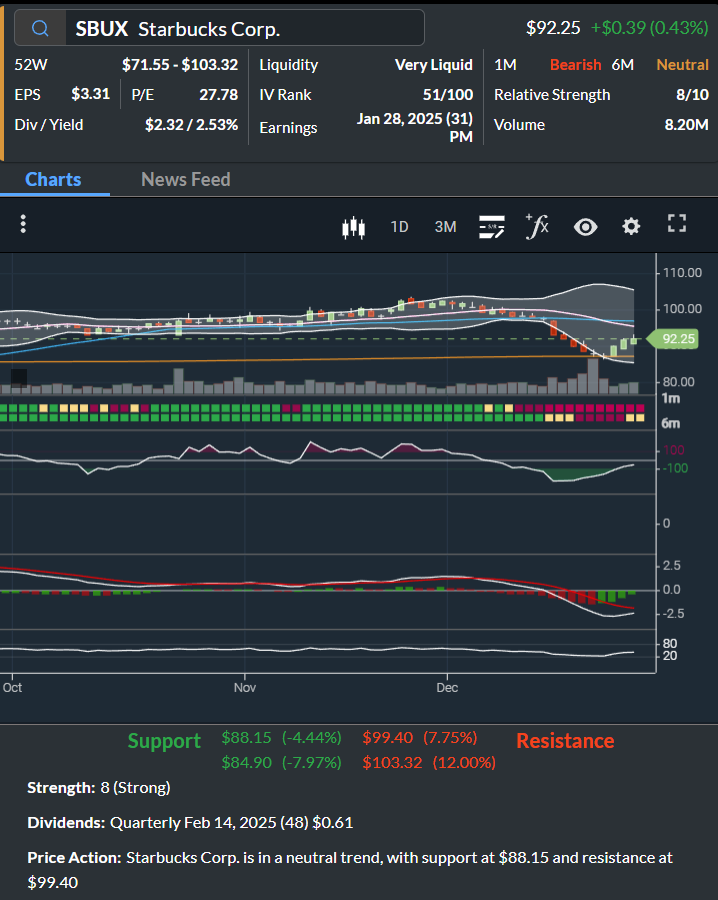
Here’s what caught my attention: SBUX is sitting near $88.15, a critical support level, and what happens next could dictate the stock’s short-term direction. Let’s analyze step by step.
1. Trend Analysis
Short-term Trend:
The stock is currently bearish, with lower highs and lower lows—a clear sign of downward momentum.Long-term Trend:
Over the past 6 months, SBUX has been range-bound between $88.15 (support) and $99.40 (resistance). This neutrality in the long-term trend makes the current short-term action even more critical.
At $92.25, the stock is closer to support than resistance. The question is whether $88.15 will hold, or if the stock will break lower and extend its bearish momentum.
2. Momentum Indicators
MACD:
The MACD line is below the signal line, with a negative histogram. This indicates bearish momentum, consistent with the downward trend.RSI:
The RSI is trending lower but hasn’t reached oversold territory yet. This suggests there may still be more downside before a potential reversal.
3. Volume: A Key Signal
Volume helps us gauge the conviction behind recent price moves:
Recent sell-offs have been accompanied by high volume, signaling strong conviction among sellers.
Conversely, bounces have occurred on lower volume, indicating weaker demand from buyers.
A reversal will require high volume on an up day, which hasn’t happened yet. Volume is an essential factor to watch in the coming days.
4. Support and Resistance Levels
Support:
$88.15 is the key level to watch. A break below this could trigger further selling, with the next support level at $84.90.
If $84.90 fails, the stock could head lower toward $80.
Resistance:
The first resistance zone lies between $92–$95, where sellers have repeatedly stepped in.
Major resistance is at $99.40, the top of the 6-month range.
What happens at $88.15 will set the stage for SBUX’s next major move—whether that’s a bounce or a breakdown.
Key Levels to Watch
$88.15 Support:
This is the most critical level. If it holds, we could see a bounce back toward $92 or higher. If it breaks, the stock may continue lower.Volume on a Test of Support:
Pay close attention to the volume during any test of $88.15. A bounce with low volume might not hold, while a high-volume break could confirm bearish momentum.RSI Oversold Levels:
If RSI dips below 30, it could signal an oversold condition and a potential reversal. However, oversold conditions are not guarantees, so wait for price action to confirm.
Why This Chart is a Perfect Lesson
Starbucks provides a textbook example of how technical analysis can uncover opportunities amid the noise. The stock’s short-term bearish trend, critical support level, and key momentum indicators offer a great case study for:
Understanding the relationship between price action and volume.
Identifying when a stock is at a decision point (like $88.15).
Combining technical signals to prepare for either a bounce or a breakdown.
This analysis also reminds us to avoid chasing headlines. While union strikes and slowing growth may influence sentiment, the chart tells us where the stock is truly headed.
Closing Thoughts
Starbucks’ short-term challenges—union strikes, leadership changes, and slowing demand—are worth monitoring. However, the chart is where the real opportunities lie. All eyes should be on price action, volume, and momentum to determine the stock’s next move.
Whether you’re looking for a reversal or continuation, the technicals will provide the answers. Stay patient and let the price confirm your thesis.
That’s it for today, traders! Let me know what you think of SBUX or drop a comment with another stock you’d like me to analyze. Until next time, stay sharp and trade smarter! -EC 🎯
P.S. Share this breakdown with anyone who loves technicals—it’s always better when we learn together!
*Disclaimer The examples and information in this article are for educational purposes only and not financial advice
Looking For More Trade Ideas? Follow Me on Twitter/X EdwardCoronaUSA


Looks like a good ticker to track for future probability. Thank you for sharing the technical information