
☁️ Cloudflare ($NET): Trending Strong But Can the Trend Keep Running?
💡Daily Trade Idea –Tuesday, Aug. 5, 2025 – $NET Trade Setup and Technical Breakdown

Hey everyone —
Today I’m taking a close look at Cloudflare Inc. ($NET). This one’s been holding trend while most of the market chops around, and today’s pullback didn’t do much to change that. I’m watching it closely and have a trade in place and along with trade setups for both short-term and long-term positioning. — I’ll get to that in a bit.
For now, let’s walk through the chart and see what this setup is telling us.
📰 What’s Going On?
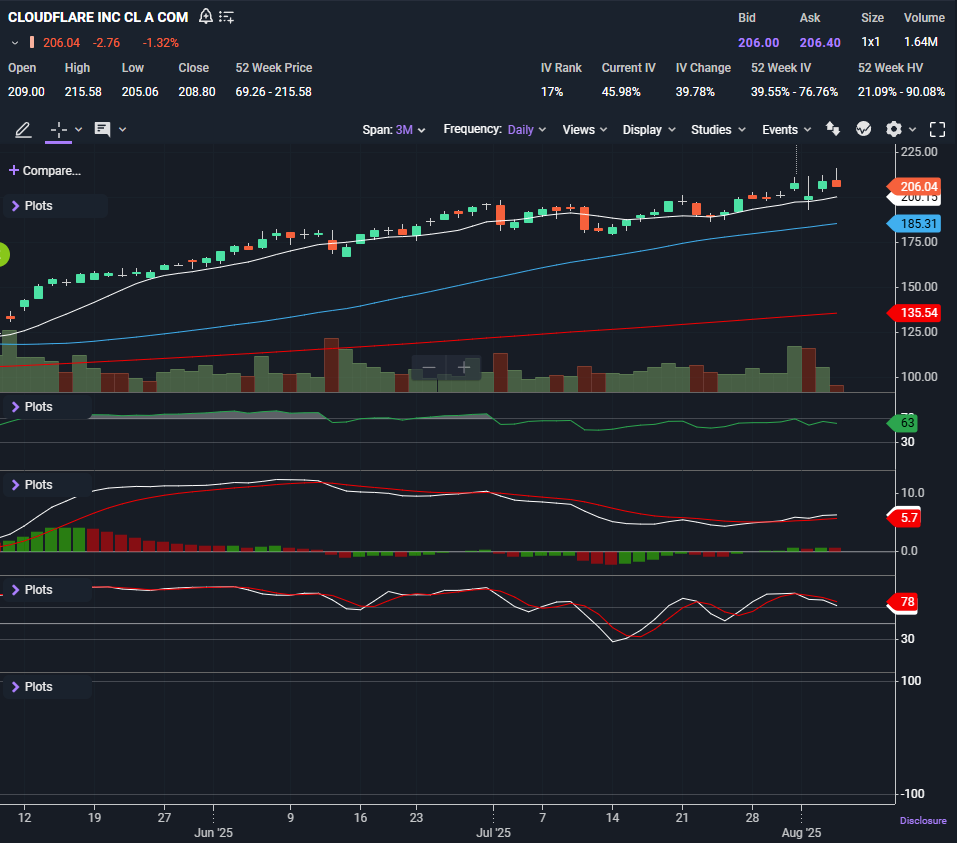
There’s no new headline on Cloudflare today — but it’s been riding the AI infrastructure wave, sitting near the top of its 3-month range. The stock hit a fresh 52-week high ($215.58) yesterday, and even with today’s dip, it’s holding structure cleanly.
📍 Live Price: $205.90
📉 Change: –$2.91 (–1.39%)
📆 Chart Date: Tuesday, August 5, 2025 (Live Data)
🧭 Technical Breakdown
🔹 Price Action & Candlesticks
Even with today’s pullback, this chart still screams strength.
Price opened at $209.00, dropped as low as $205.06, and is hovering near the middle of the day’s range. The candlestick is clean — not a breakdown, not a reversal, just a healthy pullback after a major push higher over the past 3 weeks.
Price remains above the 10-day SMA, and there’s no heavy selling volume today. That tells me this isn’t distribution — it’s digestion.
🔹 Moving Averages
10-day SMA: $200.16
50-day SMA: $185.31
200-day SMA: $135.54
Price is still comfortably above all three major moving averages.
The 10-day is acting as near-term support
The 50-day hasn't been tested since mid-June
The 200-day is nowhere in sight — that’s how strong the trend has been
This is a clear uptrend structure with plenty of room before any real damage shows up.
🔹 RSI: 63
Momentum is healthy. Not overbought, not fading. RSI has stayed above 60 for weeks — confirming sustained strength.
🔹 MACD
MACD line is still above the signal line, and the histogram is slightly positive — but momentum is flattening.
This is what you expect to see after a big run: momentum cooling, not reversing.
🔹 Stochastics: 78
Hovering near overbought, but still above the 50 line. No bearish cross yet — this is still in bullish territory, just stretched.
