
🛡️ CrowdStrike $CRWD – Record ARR, Cautious Guidance: Buyable Dip or Warning Sign?
💡Sunday 8/31 Deep Dive Weekend Edition breaks down $CRWD

Hello traders and investors,
For this Sunday’s deep dive, I’m taking a look at CrowdStrike ($CRWD). The stock has been moving after earnings this week, and it’s one I’m adding to the watchlist. The numbers looked solid — record net new ARR and an EPS/revenue beat — but guidance came in cautious, and that was enough to knock it lower.
Let’s walk through the story, break down the chart, and I’ll show you how I’d play it short-term and long-term.
What Just Happened
CrowdStrike posted a strong Q2, topping expectations on EPS and revenue while delivering record net new ARR of $221 million, a nice rebound from the softer Q1 number. Annual recurring revenue climbed to $4.66B, up 20% year over year.
They also announced a $290M acquisition of Onum Technology, a Madrid-based company specializing in real-time telemetry pipeline management. This move strengthens CRWD’s Falcon platform, especially in handling massive data streams efficiently — a smart addition given the explosion of endpoint and cloud telemetry.
So why did the stock sell off? Guidance. For Q3, CRWD guided EPS above estimates, but revenue of $1.208–1.218B came in just shy of consensus. Management also reaffirmed full-year revenue in-line with prior projections, while still dealing with lingering headwinds from Customer Commitment Packages (CCPs) tied to last year’s Falcon outage. Those programs have been a $10–15M quarterly drag and will continue through FY26 before rolling off in FY27.
The silver lining: management expects net new ARR growth to accelerate nearly 40% in the back half of FY26 as CCPs fade and enterprise spending rebounds. That’s a strong demand signal, especially as customers consolidate security tools onto Falcon.
Bottom line: strong quarter, record ARR, smart acquisition — but guidance tempered near-term expectations.
The Chart Breakdown
Here’s what I’m seeing:
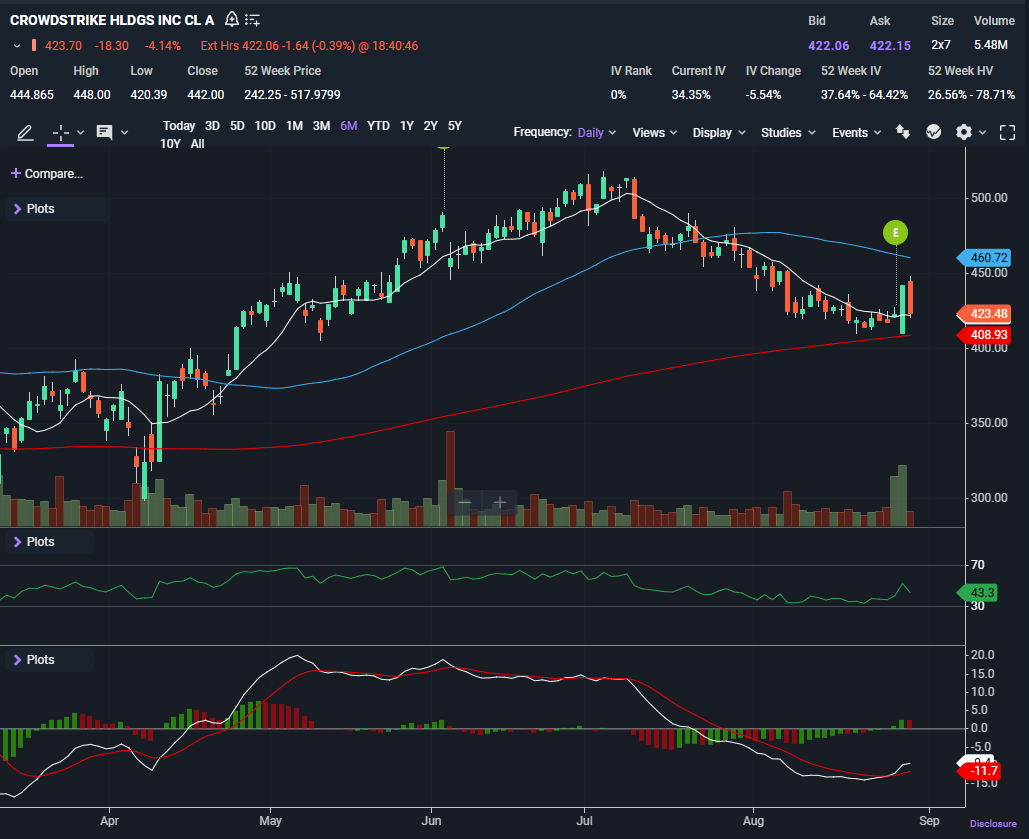
Price Action & Candles: CRWD closed Friday at $423.70, coming off a sharp post-earnings dip. The candle action shows sellers in control this week, but the stock is still trading above its 200-day, holding a bigger uptrend.
Moving Averages:
10-day SMA: $422.32 → Price closed right around this line. Short-term momentum support.
50-day SMA: $460.72 → That’s the ceiling overhead.
200-day SMA: $408.93 → Major long-term support. As long as this holds, the bigger trend is intact.
Pattern: Failed breakout at $475 earlier this summer, now in pullback mode. Looks like a re-test of trend support rather than a trend break.
Indicators
RSI 43: Weak, but not oversold. Momentum is soft, but there’s room for another leg lower before dip buyers jump in.
MACD (Bearish): Rolling down, histogram negative. Confirms the momentum loss.
The indicators confirm what the chart is telling us: near-term weakness, but no extreme oversold conditions yet.
