
📊 Cutting Through The Noise Using Point-and-Figure (P&F) Charts 📈
Unlock the power of P&F charts to simplify your market analysis and spot key breakouts

Hey Traders,
I hope you’re all doing well and sharpening your strategies as we dive into another week of trading. Today, I want to chat about an often-overlooked charting method that doesn’t get the attention it deserves—Point-and-Figure (P&F) charts. While most traders are glued to their candlestick charts, P&F charts offer a unique way of looking at price movements that cuts through the noise. Let’s dig into what these charts are, how you can use them, and whether or not they’re a fit for your strategy.
What is a Point-and-Figure (P&F) Chart? 🤔
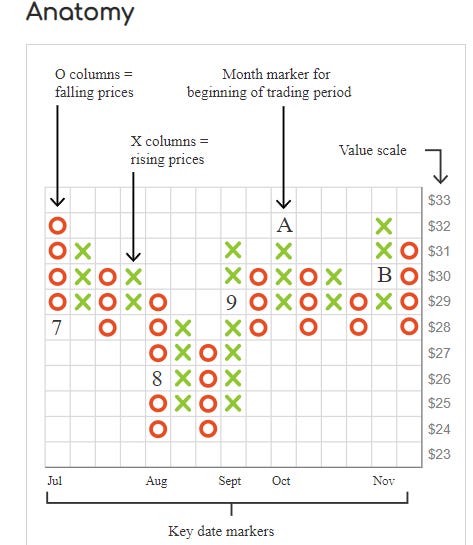
Point-and-Figure charts are a bit of an old-school relic, but don’t let their vintage vibe fool you—they can be a powerful tool in your trading toolbox. Unlike traditional charts, P&F charts don’t factor in time. Instead, they focus solely on price action by plotting a series of Xs and Os:
Xs represent rising prices 📈
Os represent falling prices 📉
When the price rises by a certain amount (known as the box size), you get an X. When it falls by that same amount, you get an O. The result is a simple, straightforward chart that eliminates small, insignificant price fluctuations and highlights major trends.
Why P&F Charts are Cool:
Noise reduction: You’re only seeing important price moves. There’s no overthinking small price swings.
Focus on supply and demand: These charts are pure price action—no time or volume to cloud the picture.
Clear entry/exit signals: Breakouts, trend lines, and support/resistance levels are easy to spot.
P&F charts may look different from what you’re used to, but they can give you a fresh perspective on price movements. If you like keeping things simple and focusing on price action alone, these could be right up your alley.
What Does a Point-and-Figure (P&F) Chart Tell You? 📋
Alright, so how do you actually use a P&F chart to make a trade? At its core, P&F is all about identifying trends and breakouts. Because these charts filter out minor price movements, they make spotting bigger trends easier. Here are a few things you can watch for:
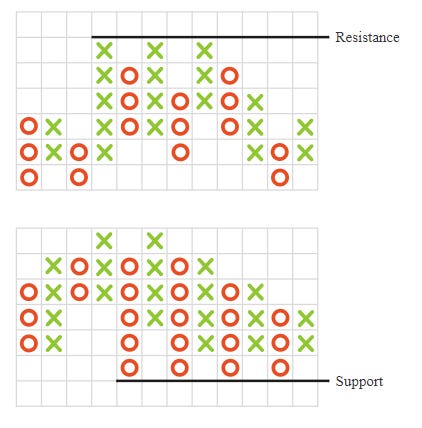
1. Support and Resistance Levels
P&F charts make it easier to see where the price has struggled to break through or fall below. These are your key support and resistance levels. Once a price breaks through a key level, it could mean a strong trend is about to emerge.
2. Breakout Signals
When the price breaks through a horizontal resistance level (after a series of Xs), that’s often your buy signal. Conversely, if it breaks below a horizontal support level (after a series of Os), it might be time to sell.
3. Trend Lines
Drawing trend lines on a P&F chart is straightforward and clean. You’re focusing on the general price movement, not every little wiggle on the chart. If your trend line breaks, it could be a signal that the momentum is shifting.
4. Price Targets
Using a method called the vertical count, you can estimate the price target for a trend. This involves measuring the length of the column of Xs or Os that broke through support or resistance and projecting that distance up or down from the breakout point.
Point-and-Figure Analysis Limitations ⚠️
Of course, no tool is perfect, and P&F charts have their limitations. Let’s talk about a few drawbacks you should be aware of:
1. Lack of Time Reference
One of the unique features of P&F charts is that they ignore time, but that’s also one of its downsides. You won’t know how long a price move took—just that it happened. If time matters in your trading (maybe you’re a day trader or swing trader), P&F might not provide the full picture you need.
2. Subjectivity in Box Size
The "box size" (the amount of price movement required to create an X or O) is crucial to how your chart looks, and it’s somewhat subjective. Different traders may choose different box sizes, which could lead to different interpretations of the same stock.
3. Fewer Users = Less Confirmation
Because P&F charts aren’t as widely used as, say, candlesticks, there’s less of a "herd mentality" that might confirm your signals. You might see a breakout on your P&F chart, but fewer traders will be watching the same signal, meaning less volume and momentum might follow through.
Accuracy of Using Point-and-Figure (P&F) Charts 🎯
You’re probably wondering, “How accurate are P&F charts, really?” Well, like any tool, it depends on how you use them and the market conditions. P&F charts work well in trending markets because they filter out a lot of the chop. If you’re trading in a sideways market, though, you might get false signals or have trouble identifying clear opportunities.
Here’s my take: P&F charts offer an excellent way to spot breakouts and track big trends. They work best when combined with other forms of technical analysis like moving averages or indicators like RSI to confirm what you’re seeing. As with any strategy, there will be hits and misses, so backtest and use proper risk management when you trade using these charts.
Final Thoughts—Should You Add P&F Charts to Your Trading Arsenal? 🤔💭
So, are P&F charts right for you? If you like simple, no-nonsense analysis that helps you cut through market noise, then yes, they’re worth exploring. They aren’t as flashy or popular as candlestick charts, but they can provide clean signals for breakouts and trend reversals. I personally like using them to confirm trends I see on other charts—it’s like getting a second opinion without adding complexity.
Give them a shot! Try incorporating them into your analysis for a few weeks and see if they help you make more confident, clearer decisions.
As always, I’d love to hear how it goes! Drop a comment below, or hit reply and let me know if you’ve used P&F charts before and what your experience has been.
Happy trading! -ec🚀
*Disclaimer The information in The Options Oracle is my opinion, not financial advice.
Looking For More Trade Ideas? Follow Me on Twitter / X at EdwardCoronaUSA
When I use point-and-figure charts in my posts, I get complaints that I'm not using the modern candlesticks or high/low/close charts. This tells me that pnf charts are not widely used by retail traders -- and so they are useful.