
Deep Dive:🍻 Cracked but Not Broken What’s Brewing at Constellation Brands (STZ)
Post-Earnings Playbook, Analyzing STZ After Its Post-Earnings Reversal

Hey traders and investors —
I’ve got a good one for you today.
This weekend’s deep dive is all about Constellation Brands Inc. ($STZ) — the company behind Modelo, Corona, and a portfolio of premium wines and spirits that’s seen more volatility than a happy hour crowd.
After a disappointing Q1 earnings print and a rough ride down from its highs, the stock is starting to show signs of life again. I’m going to break everything down in plain English: we’ll walk through the recent story, analyze the chart step-by-step, and I’ll show you how I’d trade this name from both a short-term trader’s perspective and as a long-term investor.
I’ll give you levels, setups, and even how I’d approach it if the chart breaks down again. So whether you're bullish, bearish, or somewhere in between — I've got you covered.
🍺 The Story Behind the Chart
Constellation just posted Q1 results that came in below expectations. Sales dropped 5.5% year over year — their biggest decline in over a year — and EPS missed the mark for the second time in three quarters. The biggest drag came from their Beer segment, which is usually their strongest. Hispanic consumers, who make up about 50% of their beer sales, are feeling the pinch of inflation and higher prices at the pump. Add in some aluminum tariffs, and it’s been a tough quarter.
The Wine & Spirits segment? Even worse — a 21% drop in organic net sales, and operating margins flipped from profit to loss. They’ve been trying to “premiumize” that side of the business by shifting away from mainstream brands like SVEDKA, but the transition hasn’t gone smoothly.
Now here’s the twist: even with all that bad news, the company reaffirmed guidance. Management still expects FY26 EPS between $12.60–$12.90, and they’re banking on a second-half recovery — driven by cost savings and possibly lower interest rates if the Fed cuts.
That helped spark a 5% post-earnings rally — a classic “better than feared” reaction.
📈 Technical Breakdown — Let’s Talk Chart
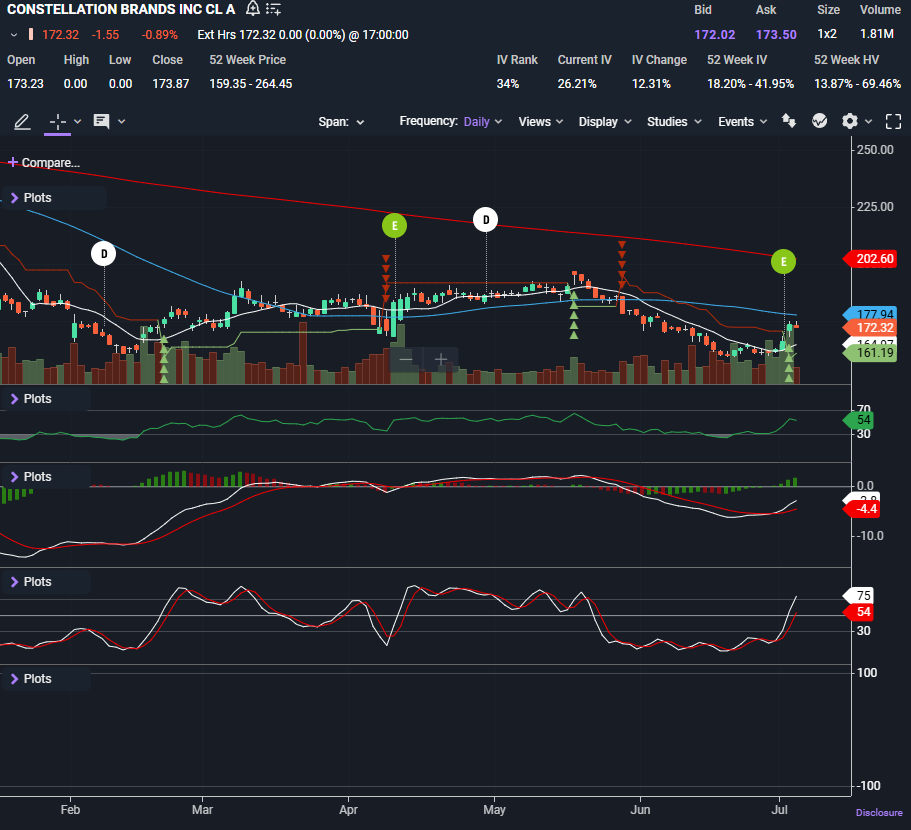
Let’s pull up the daily chart. STZ closed Thursday’s short session at $172.32, and while it’s bounced hard off the June lows, we’re still looking at a very mixed chart. Here’s how I see it:
🔻 Trendlines & Price Action
Price is still below the 200-day SMA (currently at $202.60), which tells me the long-term trend remains down for now.
However, the stock just reclaimed the 10-day and 50-day SMAs (now sitting at $164.97 and $177.94, respectively), which shows short-term momentum has shifted to the upside.
The recent bounce came with above-average volume, suggesting buyers are stepping in — not just weak hands covering.
📏 Support & Resistance
Nearest support:
$166.35 — where price bounced post-earnings.
$159.35 — the YTD low and a must-hold for bulls.
Overhead resistance:
$220.35 — major line in the sand and prior breakdown zone.
$259.25 — unlikely to test anytime soon, but it marks the longer-term target if a sustained trend develops.
💪 RSI (Relative Strength Index)
The RSI just surged to 54, up from oversold levels.
It’s far from overbought, and this is exactly the kind of action you see when a potential trend reversal is brewing.
📉 MACD (Moving Average Convergence Divergence)
MACD is crossing bullish, with the histogram flipping green.
This crossover is early — the best signals come when it follows a base, which we now arguably have.
🔄 Stochastic Oscillator
The %K line just crossed above %D and surged toward 75 — a short-term overbought reading.
That tells me a small pullback or consolidation could come next, but the bullish momentum is real.
