


🛒 Deep Dive: Walmart’s Stock Is Sitting Tight — What’s It Waiting For?
A Technical Breakdown with Trade Ideas for Short-Term Position Traders and Investors

Hey traders and investors,
Walmart’s one of those names that never really goes out of style. Whether the market’s raging higher or getting smacked around, this retail beast always seems to hold its ground. And right now, $WMT is doing just that — holding steady. But the chart is giving off some interesting signals, and I’ve been keeping a close eye on it.
In today’s breakdown, I’m going to walk you through the current setup I’m seeing in Walmart. I’ll show you where I think the stock could be headed, how I’d approach it both as a position trader and as an investor, and why this one could turn into a sneaky mover if it breaks out of its current range.
Let’s get into it.
📜 The Story Behind the Chart
Walmart ($WMT) recently made headlines for beating earnings expectations and raising its full-year guidance — again. Revenue came in strong thanks to steady foot traffic, a bigger push into e-commerce, and their growing presence in health care and delivery services.
They’re not just the low-price leader anymore. Walmart’s leaning hard into tech upgrades, automation, and digital shopping — and Wall Street is starting to take notice. Even with inflation biting and the consumer feeling squeezed, they’ve managed to keep margins tight and grow.
But even with the positive headlines, the stock hasn’t really taken off. It’s been consolidating in a tight range for weeks now. That’s what caught my attention. Sometimes no move is the move — and when these setups break, they break fast.
📊 Technical Breakdown
Walmart’s chart is stuck in what I’d call a classic “coiling” phase. Let’s walk through what I’m seeing on the chart and what it means:
🔹 Price Action
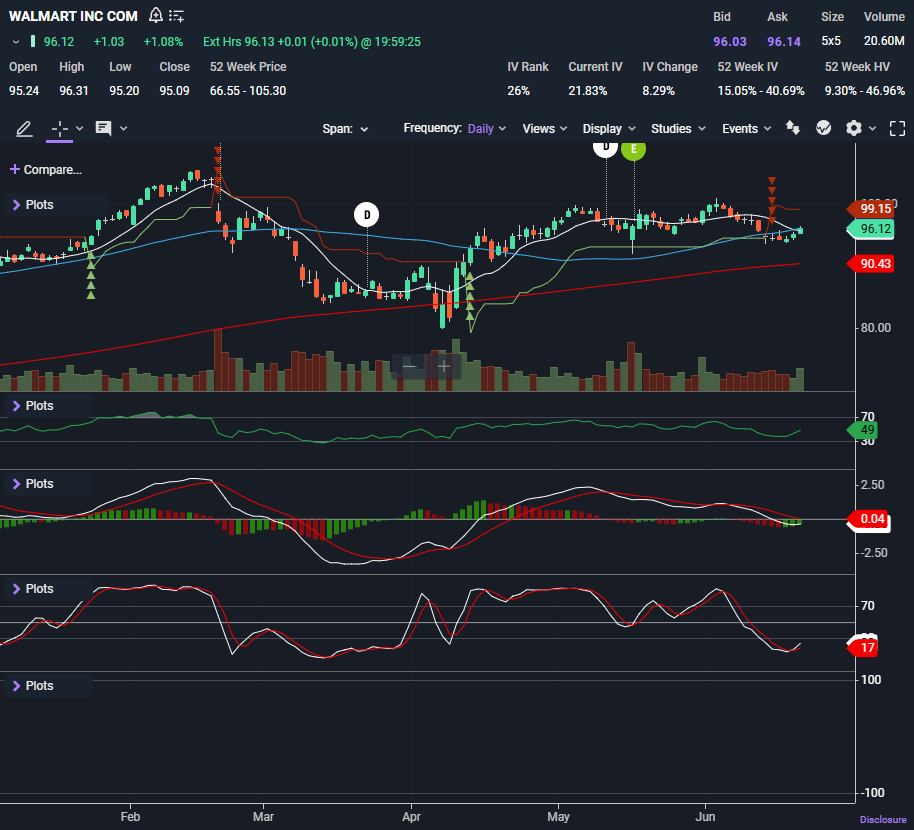
The stock’s been grinding sideways just under $97 for nearly a month.
It’s holding the 50-day moving average but hasn’t made a convincing push above the 20-day recently.
Volume has been light — a sign that traders are waiting for a catalyst.
This is what I look for before a potential breakout or breakdown. The calm before the storm.
🔹 Support Levels
$90.43 is your first line in the sand (the 200-day moving average). If that goes, momentum sellers will step in fast.
Below that, $87.87 and $82.37 are your next big support zones — both of which were previous demand zones earlier this year.
🔹 Resistance Levels
The key resistance is $100.37 — a level that’s been tested a few times but never cracked.
If Walmart clears this, the next target is $104.76, which lines up with the 52-week high.
A break above $100.37 on volume could open the door to a new leg higher.
🔍 Indicators Breakdown
📈 RSI (Relative Strength Index): 49
Right around neutral. This means it has room to run in either direction — not overbought, not oversold.
If it starts rising toward 60+, that would confirm bullish momentum building.
📉 MACD: Slight Bullish Cross
The MACD line just ticked above the signal line. It’s subtle, but it’s a constructive sign.
Momentum is shifting upward again, but it’s still early — so don’t chase just yet.
📉 Stochastic Oscillator: 17
Oversold territory, and looks like it wants to turn higher.
If it crosses up this coming week, it could be a nice early signal that the price is ready to move.
🧭 How I’d Trade It
Keep reading with a 7-day free trial
Subscribe to The Options Oracle to keep reading this post and get 7 days of free access to the full post archives.