


🎯From Stuck in Traffic to Full Throttle: $LYFT’s Breakout
Chart Analysis, Trade Setups, and How I’d Play This 28% Earnings Move

When Fundamentals Meet the Tape—And the Tape Goes Vertical
Hey traders and investors,
I’ve got a big one for you this weekend.
I’m breaking down $LYFT—yeah, that Lyft. The one everyone thought was stuck in second place behind Uber. Well, not this week. Shares exploded 28% higher, putting in one of the most eye-catching moves on the tape after reporting earnings. And it wasn’t just some short squeeze or knee-jerk spike—it came with real institutional volume and strong guidance behind it.
The news cycle around LYFT was a roller coaster. They missed earnings and revenue in Q1, but still rocketed higher. Why? Because the market had already priced in doom after Uber's meh report. So when LYFT showed they weren’t falling apart—in fact, far from it—it was game on.
Let’s set the scene:
Gross bookings? Solid.
Rides? Record-breaking.
EBITDA? Surging.
Proxy fight? Resolved.
Buyback? $750M.
Q2 guide? Better than expected.
When you stack all that together, you’ve got the recipe for a breakout. And the chart? It's the best part of the story.
Let’s get into it.
📈 Technical Breakdown
Alright, now for the fun part. Let’s walk through what’s happening on the chart—and I’m going to break it down so that even if you're brand new to charts, you'll walk away understanding why this setup matters.
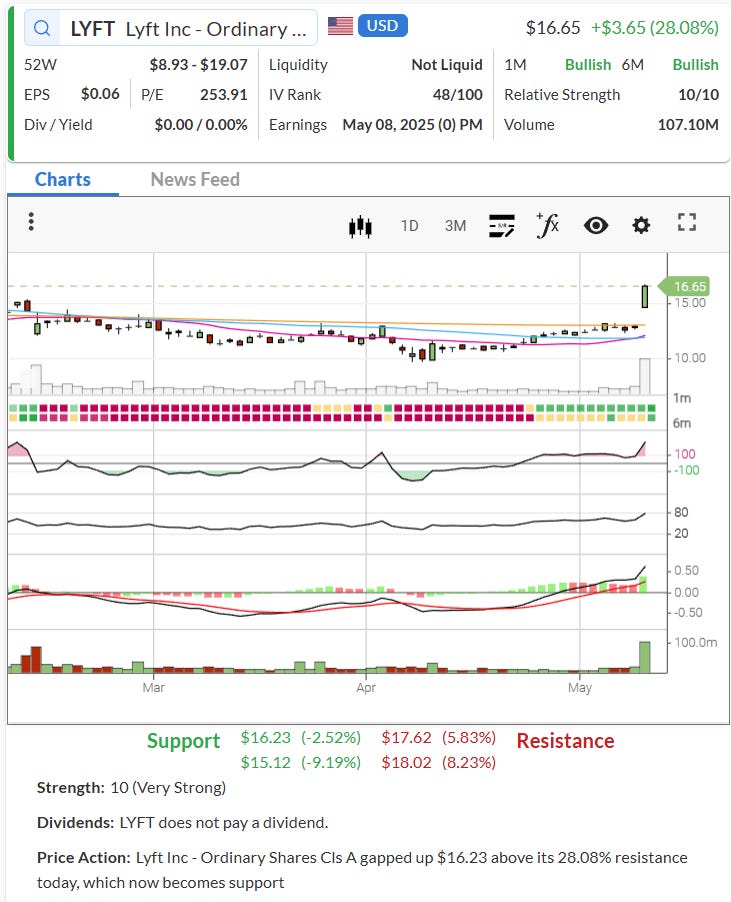
📊 Price Action
We saw a textbook gap-up breakout. LYFT jumped above $16.23—which was a key resistance level—and closed the day at $16.65, up +28.08%. This isn't some fluke move; it's a confirmation candle on massive volume.
That gap-up now turns former resistance into new support. This is classic price action theory: once price breaks through a ceiling with strength, that ceiling becomes the floor.
📉 Support and Resistance Levels
New Support: $16.23 (former resistance, now your risk line)
Next Support Zone: $15.12 (where the 50-day moving average was clustering)
Resistance Ahead: $17.62 and $18.02—these are your near-term target zones
These resistance levels are based on previous supply zones—price areas where sellers stepped in earlier this year.
🔍 Volume
Look at that volume spike—over 107 million shares traded. That’s not just day traders. That’s funds getting involved. When you get institutional volume behind a breakout, it validates the move.
Big volume + gap-up = conviction.
🟢 Trend Strength: 10/10
This is as strong as it gets.
⚙️ Indicators: MACD, RSI, and Moving Averages
MACD
The MACD line crossed above the signal line and it’s gaining steam.
This is a bullish momentum trigger.
We also see the histogram expanding—a sign of accelerating momentum.
RSI (Relative Strength Index)
Sitting at 79 right now—yes, it’s overbought.
But in momentum breakouts like this, RSI can stay overbought for a while.
That’s a feature, not a bug, when you’re in a strong trend.
Moving Averages
Price is now well above all key moving averages (10-day, 20-day, 50-day).
The moving averages are curling up and may converge into a bullish alignment (shorter MA above longer MA).
This is what swing traders call a “moving average stack.”
💡 How I’d Trade It
🔹 For Traders:
If you're looking for a short-term trade, here's how I’d approach it:
Entry: $16.40–$16.65 (buy on a slight pullback or continuation above Friday’s close)
Target 1: $17.62
Target 2: $18.00+
Stop: Below $16.23 (this is your gap support, and a logical place to bail if it fails)
This is a momentum continuation setup. If it keeps grinding higher with volume, ride it. But if it starts to stall and drop below $16.23, cut it. No hesitation.
🔹 For Investors:
If you believe in the longer-term turnaround story—new leadership, buybacks, profitability improving, and that expansion into Europe—you could build a position like this:
Starter Entry: Now (near $16.65)
Add More: On dips near $15.00–$15.50 (if it ever pulls back)
Hold Target: $20+ over 3–6 months
Risk Management: Re-evaluate if it closes below $14
This would be a buy-the-turnaround strategy. You’re betting on management getting their act together, cost controls sticking, and LYFT carving out a lane as a legit second player in a duopoly.
🧠 Wrapping It All Up
This move on $LYFT isn’t just some speculative spike. It’s a technically sound breakout with real fundamental tailwinds behind it: a buyback, improved profitability, solid Q2 guidance, and the end of a messy boardroom drama. That’s a lot of boxes checked. The chart confirms what the news flow is saying: big money believes there's more upside here. As always, this isn’t a recommendation to buy blindly. But if you’ve been watching LYFT sit in the backseat for a while, this might be the moment it finally grabs the wheel.
Let me know in the comments—are you buying the Lyft breakout? Or do you think this was a one-day wonder?
📬 Want Daily Breakdowns Like This Sent to You?
If this kind of deep-dive analysis helps you and you want more like it — daily stock ideas, technical breakdowns, entry zones, and trade management tips — I deliver it straight to your inbox every day. Consider upgrading to a paid subscription to The Options Oracle.
🔒 Upgrade to a paid subscription here and start trading with an edge.
*Disclaimer: The examples in The Options Oracle are my opinion, not financial advice.