
🔍 Harnessing Market Magic with Fibonacci: A Trader's Guide 📈
Unlocking Key Levels with Powerful Tools and Indicators

Hello, everyone! 👋
In the midst of the market's recent sell-off, there's no better time to delve into the power of Fibonacci Levels. Fibonacci Levels can be incredibly useful in both sell-offs and trends. During a sell-off, they can help identify potential support levels where the market might find a bottom. In trending markets, they serve as key points to spot retracements and extensions, aiding in making informed entry and exit decisions. So today I’ll explore how these timeless tools can help pinpoint new support and resistance levels, offering clarity in the chaos.
Fibonacci retracements and extensions are some of the most powerful tools in technical analysis. Understanding and incorporating Fibonacci levels into your trading strategy can significantly enhance your decision-making process and boost your profitability. So, let’s unravel the mysteries of Fibonacci and learn how to effectively use these tools and indicators in your trading.
What is Fibonacci? 📏
Named after the Italian mathematician Leonardo Fibonacci, the Fibonacci sequence is a series of numbers where each number is the sum of the two preceding ones, typically starting with 0 and 1. The sequence looks like this: 0, 1, 1, 2, 3, 5, 8, 13, 21, and so on. The key aspect of Fibonacci in trading, however, is not the sequence itself but the ratios derived from it.
Key Fibonacci Ratios 📊
The most commonly used Fibonacci ratios in trading are:
0.236 (23.6%)
0.382 (38.2%)
0.500 (50.0%)
0.618 (61.8%)
0.786 (78.6%)
These ratios are used to identify potential retracement levels, where the price might reverse direction, and extension levels, where the price might reach after breaking through key support or resistance levels.
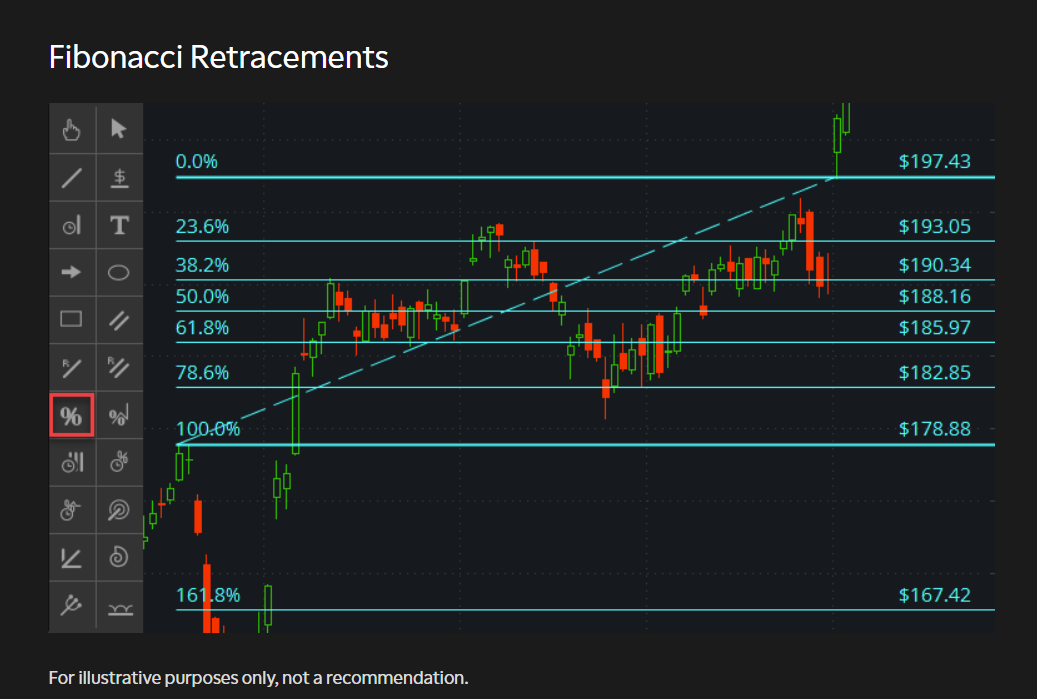
Using Fibonacci Retracements 🔄
Fibonacci retracements are used to identify potential support and resistance levels during a price correction within a larger trend. Here’s how to use them:
Identify the Trend: Determine the high and low points of the trend you’re analyzing. For an uptrend, the low point is your starting point (0), and the high point is your ending point (100). For a downtrend, it’s the opposite.
Draw the Retracement Levels: Use your charting platform’s Fibonacci retracement tool to draw the levels from the trend’s high to low or low to high.
Analyze the Levels: Look for price action around the key Fibonacci levels (23.6%, 38.2%, 50.0%, 61.8%, and 78.6%). These levels often act as potential support or resistance zones.

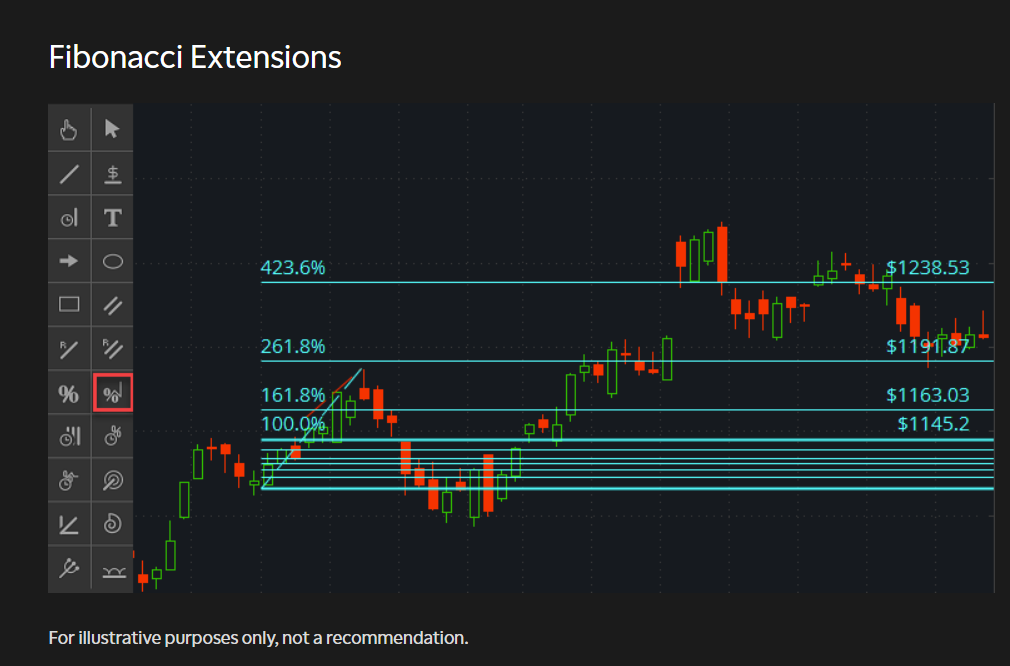
Using Fibonacci Extensions ➡️
Fibonacci extensions are used to identify potential target levels once the price breaks through the previous high or low. Here’s how to use them:
Identify the Trend: Determine the high and low points of the trend you’re analyzing, just like with retracements.
Draw the Extension Levels: Use the Fibonacci extension tool on your charting platform. For an uptrend, draw from the low point to the high point and then back down to the retracement point. For a downtrend, it’s the opposite.
Analyze the Levels: Look for potential target levels as shown below

Combining Fibonacci with Other Tools 🛠️
While Fibonacci levels are powerful, combining them with other technical indicators can provide even stronger signals:
Moving Averages: Use moving averages to confirm trend direction and identify potential support and resistance levels.
Relative Strength Index (RSI): Look for RSI levels indicating overbought or oversold conditions around key Fibonacci levels.
Candlestick Patterns: Identify reversal patterns, such as dojis or engulfing patterns, at Fibonacci retracement or extension levels.
Practical Example For Trends 💡
Let’s put this into practice with a real-world example:
Identify the Trend: Suppose a stock has rallied from $50 to $100, and you’re looking for a potential pullback entry point.
Draw the Retracement Levels: Using the Fibonacci retracement tool, draw from $50 (0) to $100 (100). The retracement levels are at $88.20 (23.6%), $81.80 (38.2%), $75.00 (50.0%), $68.20 (61.8%), and $61.80 (78.6%).
Analyze the Levels: If the stock pulls back to $81.80 (38.2%) and shows signs of support, such as a bullish candlestick pattern or a bounce off a moving average, it might be a good entry point.
Set Targets with Extensions: If the stock breaks above $100, use Fibonacci extensions to set potential targets at $111.80 (123.6%), $118.20 (138.2%), and so on.
Practical Example After a Sell-Off💡
When the market experiences a significant sell-off, and you want to use Fibonacci retracement levels to identify a potential bottom.
Identify the Recent High and Low: First, you need to determine the most recent high before the sell-off and the low point reached during the sell-off. For example, suppose the market peaked at 4,500 and then dropped to 3,800.
Plot Fibonacci Retracement Levels: Using a charting tool, draw the Fibonacci retracement levels from the high (4,500) to the low (3,800). This will generate key levels at 23.6%, 38.2%, 50%, 61.8%, and 78.6%.
Watch Key Levels: In this scenario, the key Fibonacci levels would be:
23.6% retracement: 3,951
38.2% retracement: 4,008
50% retracement: 4,150
61.8% retracement: 4,192
78.6% retracement: 4,284
Analyze Price Action: Observe how the market behaves around these levels. If the price finds support at the 38.2% retracement (4,008), it may indicate a potential bottom. Watch for signs like reduced selling pressure, increased buying volume, or bullish candlestick patterns.
Confirm with Other Indicators: To strengthen your analysis, combine Fibonacci retracement levels with other technical indicators such as RSI, MACD, or moving averages to confirm the potential bottom.
Using this approach, Fibonacci retracement levels help you pinpoint areas where the market might stabilize and reverse, providing a more strategic entry point after a sell-off.
My Take 🎯
Incorporating Fibonacci retracements and extensions into your trading strategy can provide you with a structured approach to identifying key levels in the market. While no tool is foolproof, combining Fibonacci with other technical indicators and sound risk management principles can significantly improve your trading performance.
Remember as I say a lot, trading is as much an art as it is a science. The more you practice and refine your skills, the better you’ll become at spotting those perfect entry and exit points. So, embrace the Fibonacci tools, stay disciplined, and happy trading!
Feel free to reach out with any questions or share your experiences using Fibonacci in your trading. Together, we can continue to learn and grow as a community.
Until next time, trade smart and stay confident! 💪
Best, -ec
*Disclaimer The examples in The Options Oracle are my opinion, not financial advice.
Looking For More Trade Ideas? Follow Me on Twitter/X EdwardCoronaUSA
Thank you very much!