
💻 IBM Deep Dive
📉 A Brutal Earnings Selloff May Be Creating an Opportunity, Is This the Overreaction You’ve Been Waiting For?

Hello traders and investors.
As I mentioned in one of my posts yesterday, earnings season can create some of the best opportunities we see all year, especially in stocks that normally do not give us an attractive entry.
My selection of cash-secured puts usually narrows during earnings season because I try to avoid selling one through a company’s report. I do not want a single earnings reaction turning an otherwise solid options setup into a position I never intended to own at that price.
When that part of the strategy slows down, my attention shifts toward something different.
I start looking for quality companies that have been hit hard enough to create a potential opportunity to build a position in the shares. Depending on how the setup develops, I may hold that stock longer term or trade it over the next several months for a solid profit.
Those of you who have been following my Deep Dives know that I have done very well with this approach. The goal is not to buy every stock that falls after earnings. The goal is to identify where the market may have overreacted, study what actually went wrong, and then wait for the chart to tell me when the selling is beginning to run its course.
That is why I am breaking down IBM today.
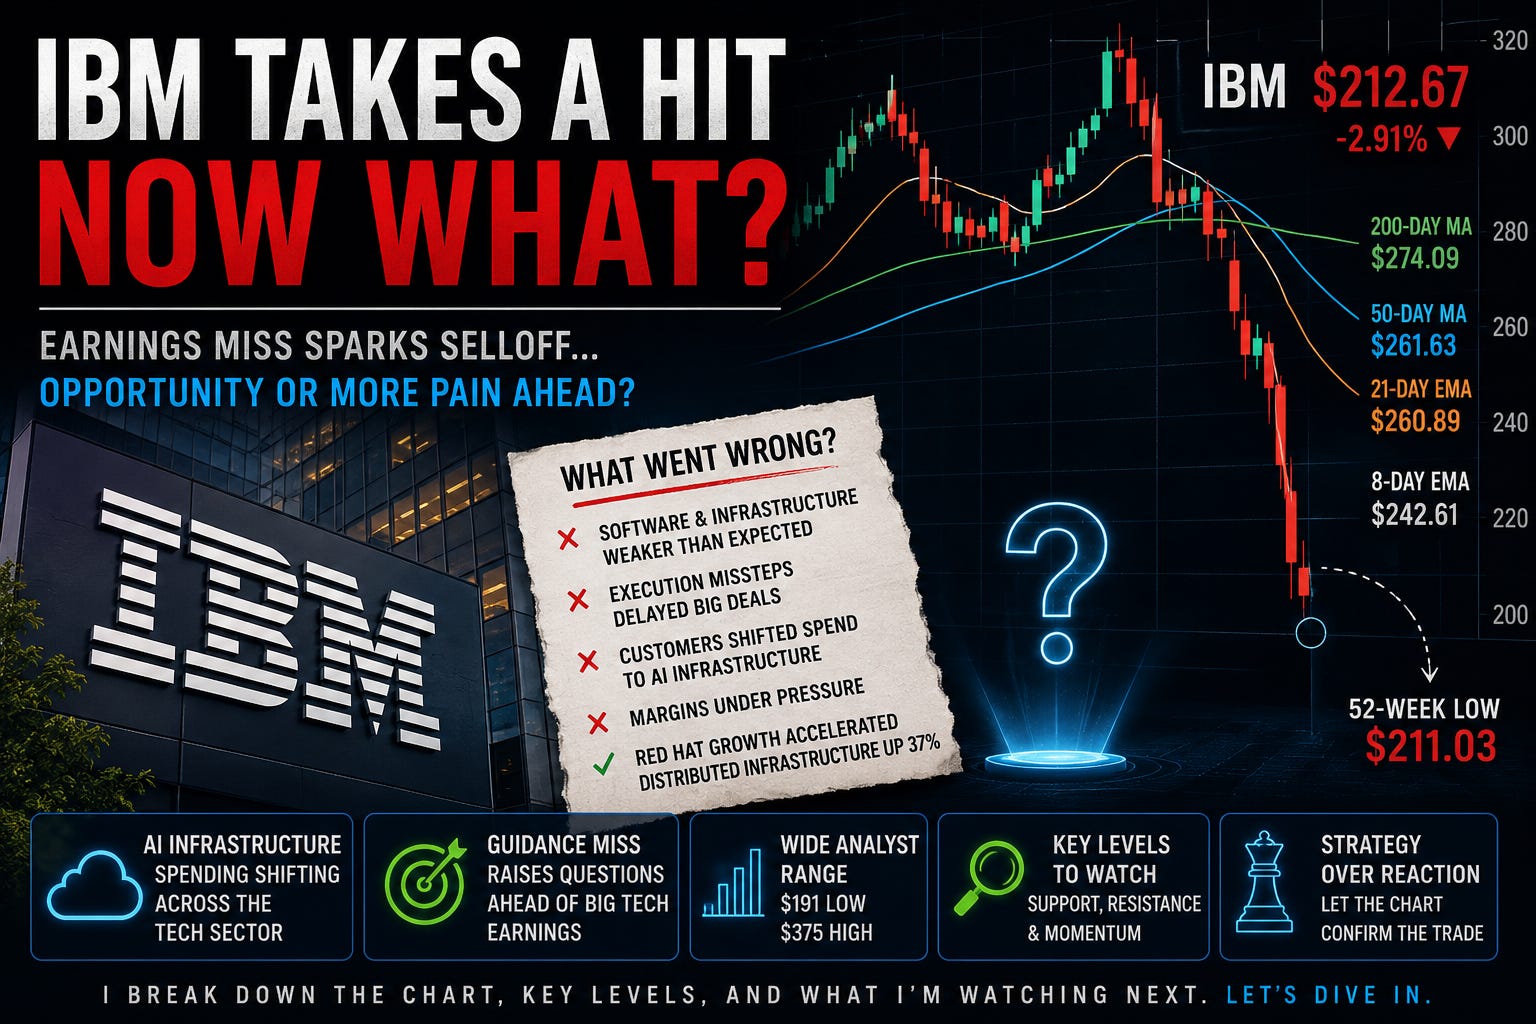
IBM closed Friday at $212.67, down 2.91% during the regular session, but the chart shows a much larger collapse from where the stock traded before the earnings reaction. The company disappointed investors with weaker guidance, acknowledged execution mistakes, and raised questions about how businesses are allocating their technology budgets.
At the same time, Red Hat accelerated, recently acquired businesses performed well, infrastructure demand remained strong, and IBM exited the quarter with a sizable backlog.
That leaves us with an interesting situation.
IBM may now be much more attractive than it was before earnings, but a lower price does not automatically make it a buy.
In this Deep Dive, I am going to explain what went wrong, what parts of the business held up, what the reaction may tell us about the broader technology sector, and exactly what I am watching on the chart.
I will also walk through the price area where I may consider starting a position, the confirmation I need before committing money, the levels where I would consider taking profits, and how I would decide whether to sell everything or leave part of the position open for a larger move.
Questions are always welcome. If you want to discuss the setup, the chart, or how I approach this type of earnings opportunity, leave a comment. I am happy to go deeper into the strategy and talk through what I’m seeing.
The key question is not whether IBM looks inexpensive after the selloff.
The real question is whether the market has already punished the company enough, or whether the chart still needs more time before a dependable opportunity develops. Lets dig in!
