
⚡️Is Cleanspark’s ($CLSK) Pullback Your Cue to Jump In?
💡Daily Trade Idea – Wednesday Oct. 22, 2025 – $CLSK Trade Setup and Technical Breakdown

Good morning traders and investors.
Today I’m making a play on Cleanspark Inc (CLSK) — one of my go-to names for premium and Wheel Strategy setups. This stock’s volatility is like a slot machine at full tilt — if you know how to manage your risk, it pays out in premium. I’ve been tracking CLSK closely because it’s been on a tear lately, ripping from the low teens to over $22 before pulling back hard. That kind of action gets my attention — momentum, volatility, and enough movement to make the options worth playing.
I’m lining up an income trade here — my goal is to collect premium now, but if I get assigned, I’m happy to own it and sell covered calls. CLSK’s the kind of name that fits perfectly in a Wheel Strategy rotation — wild enough to pay, but structured enough to manage.
📰 The Story Behind Cleanspark
Cleanspark’s story keeps evolving. Once known mainly as a Bitcoin miner, they’ve been shifting gears toward AI-driven, high-performance computing. They’ve been building out data center infrastructure powered by clean energy — a combo that has Wall Street whispering.
Here’s what’s been floating around lately:
Massive growth — revenue jumped 91% year-over-year, crossing the $190M mark last quarter.
They’ve got over $1B in BTC holdings, putting them in rare air among miners.
Analysts are warming up: a few fresh “buy” ratings have popped up with targets around $20–$24.
On the street, traders are split — bulls love the AI angle, bears think it’s still a leveraged crypto proxy.
And on Reddit? It’s classic hype vs. realism. Bulls chanting “future of mining,” bears muttering about dilution.
The chatter’s loud — and that’s exactly the kind of environment where I like to hunt income setups. When everyone’s emotional, I just let the premiums fatten.
📉 Technical Breakdown
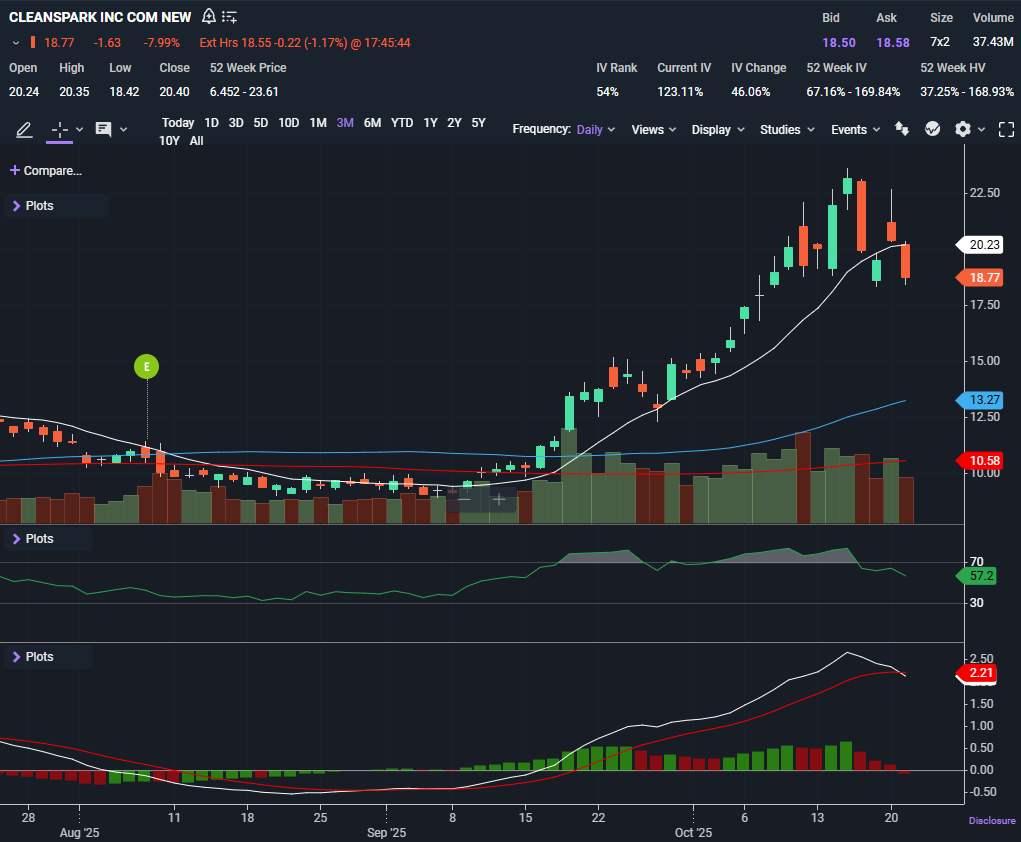
Alright, let’s talk price action. CLSK closed Tuesday at $18.77, down nearly 8% on the day — that’s a sharp move off the highs near $23. It’s the first real pullback after a huge surge. CLSK’s been on a monster run lately — it ripped from around $13 to that $23.50 zone before taking a well-deserved breather, that’s bulls taking profits, not panic sellers. Tuesday’s close at $18.77 is part of that, but when you zoom out, this still looks like a strong uptrend catching its breath, not one that’s falling apart.
The candles tell the story: last week we saw a series of long upper wicks — that’s profit-taking after the parabolic move. The red candles that followed have smaller bodies, meaning sellers are starting to lose momentum. The last few sessions show buyers quietly stepping back in around the high-$18 to low-$19 zone. That’s what I call controlled selling — not panic, just digestion.
Now, the 10-day SMA up around $20.23 is the short-term battleground. Price dipped under it, which usually shakes out weak hands. As long as we don’t see heavy volume breaking below $18, that 10-day line becomes the pivot to watch. The 50-day SMA down near $13.27 is your bigger safety net — that’s where longer-term buyers will step in if things really unwind.
Here’s what’s interesting: every pullback since July has found support well above the 50-day. That’s a sign of strength — higher lows, firm demand, and an uptrend that’s still very much alive. You can almost see the “stair-step” pattern forming on the daily chart.
Volume confirms it — the big green days came on strong participation, the red days are lighter. That’s classic bullish consolidation behavior. If we get a couple of green bars that close back over $20, that tells me the buyers are ready for round two.
Now, here’s the thing about CLSK — these kinds of swings are normal for this name. It moves fast in both directions. The key is catching it right: on a pullback for a cash-secured put, and on a green up day for a covered call. Playing the rhythm instead of fighting it is what makes this stock one of my favorite repeat setups.
📊 Indicators — Momentum Check
RSI: 57 → That’s neutral to slightly bullish. Not overheated, not weak — just resetting after an extended run. I like that, because it tells me momentum cooled off but didn’t die.
MACD: The histogram’s been fading, and the lines are starting to roll over, which fits the short-term pullback. But we’re still above zero — that’s key. Momentum’s easing, not reversing. One or two green candles and this thing could curl back up.
Bottom line: The chart’s breathing. The momentum train slowed down, but it hasn’t derailed.
