

Hey traders and investors,
Today I’m diving into Walt Disney Co. ($DIS), one of those stocks that always seems to spark debate—whether you’re a fan of the theme parks, streaming subscriber counts, or just curious if the magic is still alive in the stock price. I’ve broken everything down for you: the chart, the indicators, the levels I’m watching, and how I’d trade this thing whether you’re in it for a quick move or building a long-term position or looking to collect premium with an options trade like me.
Let’s zoom in and take a closer look—starting with what’s been happening recently with the company.
🎥 The Story So Far
Disney’s been climbing its way back from the depths of its post-pandemic hangover, and lately, there’s been a shift in the mood. In early May, the stock gapped higher after earnings beat expectations, helped by improvements in Disney+ profitability and a better-than-expected quarter from their theme parks division.
Since then, it’s been riding that wave—but now we’re starting to see some hesitation. The 6-month chart tells a story of strength... but also some consolidation.
🧠 Let’s Talk Chart
This is where the fun begins. Let me walk you through what I’m seeing on the live chart as of this morning.
📉 Price Action
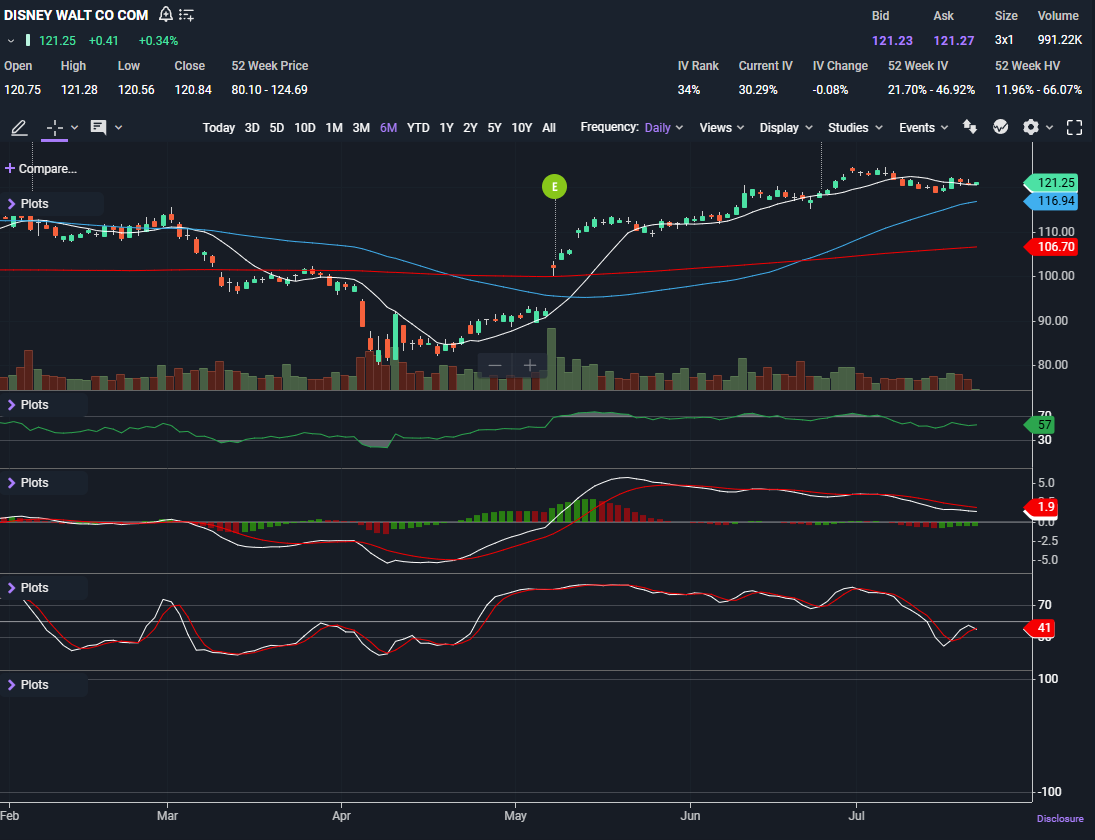
$DIS is currently trading around $121.25, breaking above the 10-day SMA, which is curled slightly upward. The 50-day SMA sitting at $116.94 is still trending nicely and offering support below. The 200-day SMA? Way down at $106.70, which tells you how far we’ve come since the March lows.
So far, we’ve got a clean uptrend. No major breakdowns, no cracks in the foundation—just a consolidation near recent highs.
Candlesticks & Trend Clues
We’ve got a tight range going on over the last few weeks. No big red candles, no reversal signals. It’s been mostly small-bodied candles with lower volume—classic signs of a digestion phase after a strong run. This doesn’t scream “breakdown” to me—it’s more like the market is catching its breath.
🔍 RSI (Relative Strength Index)
The RSI is sitting at 57, comfortably above the neutral 50 zone. It’s not overbought, not oversold—just cruising in the sweet spot. That confirms what I’m seeing in price action: this isn’t a raging breakout or a crash waiting to happen. It’s healthy consolidation after a leg higher.
📊 MACD (Moving Average Convergence Divergence)
The MACD is fading, but not crossing bearish. The histogram has been shrinking, but the lines are still above zero. That usually means momentum is slowing, not reversing. To me, it says: “cooldown, not breakdown.”
🔁 Stochastics
This one’s a little more cautious. Stochastics are coming up from oversold levels, currently around 41, and curling higher. That could be an early bullish signal forming—like the start of a bounce. If the curl continues, it supports a possible move toward resistance.
🔊 Volume
Volume’s been lower than average lately—another sign that this is digestion and not a selloff. If we see a volume spike with a move above resistance, that’s our green light for confirmation.
💡 How I’d Trade It and My Take
Alright, here’s how I’m looking at it depending on your style:
Keep reading with a 7-day free trial
Subscribe to The Options Oracle to keep reading this post and get 7 days of free access to the full post archives.