
🥩 Is Kroger ($KR): Setting Up for Another Push?
💡Daily Trade Idea –Thursday Aug. 21, 2025 – $KR Trade Setup and Technical Breakdown

Hey traders and investors,
Here’s today’s Daily Trade Idea. As always, I’m pulling a stock off my watchlist that looks ready to make a move, breaking down the chart and indicators, and then showing you how I’d trade it—short-term, long-term, and with my own options play.
For Thursday’s setup, I’m digging into Kroger Co. (KR). If you have been following along, you know I closed out a winning trade in KR just a couple of weeks ago. Since then, the stock dipped back down, but now it’s shaping up again with another solid setup. It’s not a flashy tech name, but the stock’s been holding up well, creeping higher under the radar while the market has been throwing curveballs. That kind of steady price action catches my eye—because when the big money sneaks into boring names, it often leaves footprints.
📰 What’s Been Going On?
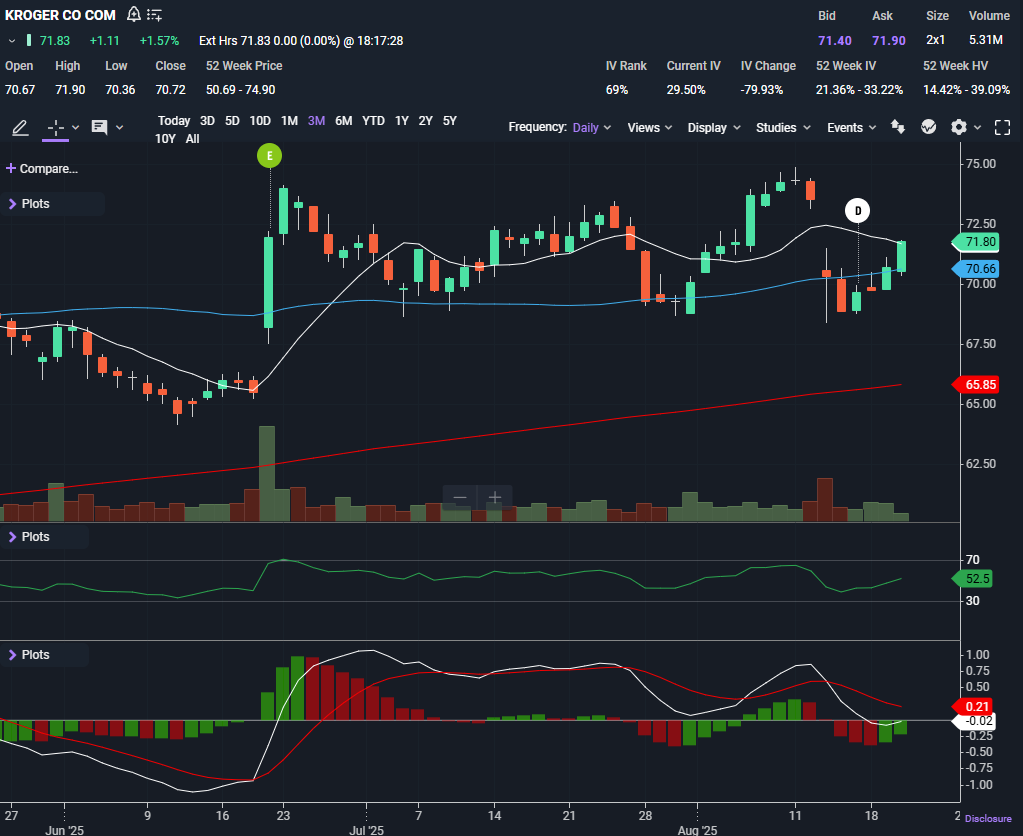
KR just closed at $71.83, up 1.57% on Wednesday. That’s two straight up days.
After I locked in profits on my last KR trade, the stock pulled back, tested support, and has now bounced—reclaiming its 50-day moving average.
Kroger’s been in the headlines for store closures in a few states, but at the same time it’s plowing $3.8B into upgrades and new stores—the market seems to like the reinvestment angle more than it fears the closures.
Analysts are lukewarm on it, but with price targets around $75, which lines up with the chart’s resistance zone.
This isn’t hype trading—it’s steady and consistent.
📊 Chart Breakdown
Price Action & Moving Averages
The stock bounced hard off the recent lows and is now back above the 50-day SMA ($70.66).
It closed just under the 10-day SMA ($71.66)—a level that’s acting like short-term resistance.
The 200-day SMA ($65.85) sits well below, keeping the long-term trend intact and bullish.
Candles are showing higher lows the past few sessions, and today’s green bar was strong—a sign bulls are quietly leaning back in.
Volume
Volume hasn’t been explosive, but it’s been steady. Think accumulation, not chase.
Indicators
RSI: 56 → Mid-range, which means there’s plenty of room to run before overbought territory (70+).
MACD → The histogram just flipped back toward green and the lines are curling upward. Early bullish momentum, but still in the infancy stage.
This tells me the stock isn’t stretched—it’s got fuel left in the tank.
