⚡ Is NVIDIA ($NVDA) a "Buy The Dip" Play?
💡Saturday 8/30 Deep Dive Weekend Edition Puts $NVDA In The Spotlight
Hello traders and investors,
For this weekend’s deep dive, I’m zeroing in on NVIDIA ($NVDA). After another monster quarter, the stock stumbled — not because demand is gone, but because expectations were sky-high. With the chart testing support, this is one of those moments where traders need to separate the noise from the signal.
Let’s talk through what happened in Q2, what the chart is showing us right now, and how I’d trade it both short-term and long-term.
What Just Happened
NVIDIA delivered Q2 results that, on paper, looked fine: EPS and revenue beat estimates, but the upside wasn’t as explosive as we’ve come to expect. Q3 guidance came in-line, which is unusual for NVIDIA’s usual beat-and-raise pattern.
The weak spot was Data Center revenue, which rose 56% year over year to $41.1B but missed Street estimates due to a $4B sequential drop in H20 chip sales tied to export restrictions. NVIDIA sold no H20 chips into China in Q2 and isn’t assuming any for Q3 either.
The flip side? The Blackwell platform is scaling quickly — GB300 adoption is strong, with production set to ramp through H2. Gaming and AI PC revenue hit a record $4.3B, up 49% year over year, while Professional Visualization and Automotive also posted strong double-digit growth. NVIDIA is sticking to its long-term view that AI infrastructure spend could hit $3–4 trillion by 2030.
So the story is this: demand is still massive, but geopolitical issues clipped the quarter and guidance came in softer than usual. Investors, used to fireworks, punished the stock short-term.
The Chart Breakdown
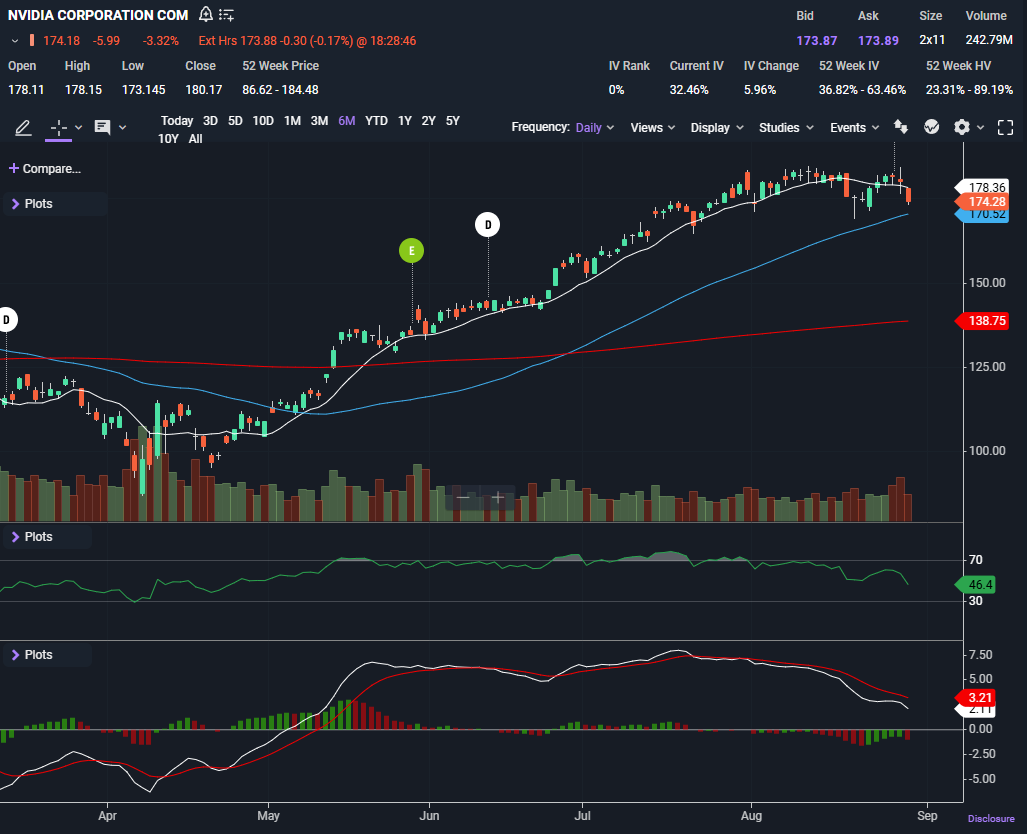
Price Action & Candles: NVDA closed Friday at $174.28, down nearly 6 bucks on the day. After running hot into earnings, it’s now pulling back, testing its 50-day moving average zone.
Moving Averages:
10-day SMA: $178.36 → Just overhead. That’s the first level bulls need to reclaim.
50-day SMA: $170.52 → Price is sitting right above this line. This is make-or-break short-term support.
200-day SMA: $138.75 → Way down below. That’s the ultimate floor in a major selloff.
Pattern: After a huge run since spring, this is the first meaningful pullback. Looks like a standard earnings reset rather than a trend break — unless the 50-day fails.
Indicators
RSI 46: Neutral, leaning weak. Not oversold yet, so there’s room lower before dip-buyers really step in.
MACD (bearish cross): Rolling over. Momentum has shifted down, confirming the short-term pullback.
Indicators line up with the chart: this is a cooling-off phase, not an oversold panic.
Trade Setups, How I Would Trade It Here
Keep reading with a 7-day free trial
Subscribe to The Options Oracle to keep reading this post and get 7 days of free access to the full post archives.


