
⚡️Is TeraWulf ($WULF) Heating Up for a Fresh Move?
💡Daily Trade Idea – Friday Oct. 24, 2025 – $WULF Trade Setup and Technical Breakdown

Good morning traders and investors —
Today I’m breaking down TeraWulf Inc. ($WULF) — a name that’s been heating up again in the clean-energy-meets-crypto space. This stock has been on my radar for a while because it combines three things I like to see before I sell premium: strong narrative, heavy volume, and short-term volatility with structure.
Let’s walk through what’s been happening with this one and why it’s back in play for a short-term income setup.
📰 The Story Behind TeraWulf
TeraWulf isn’t your average crypto miner. It’s been quietly carving out a spot as a low-cost, zero-carbon Bitcoin miner that’s now pivoting into AI-driven, high-performance computing. Earlier this month, they announced a hosting partnership with FluidStack, a Google-backed cloud computing player. That deal reframed how the Street looks at them — not just as a mining stock, but as an AI infrastructure story.
Online chatter has been buzzing since the announcement. On X, traders are split between the “AI expansion believers” and the “profit-taking skeptics.” You can feel that tug-of-war on the chart. Volatility’s been running hot — exactly the type of setup I look for when selling puts.
📊 Technical Breakdown
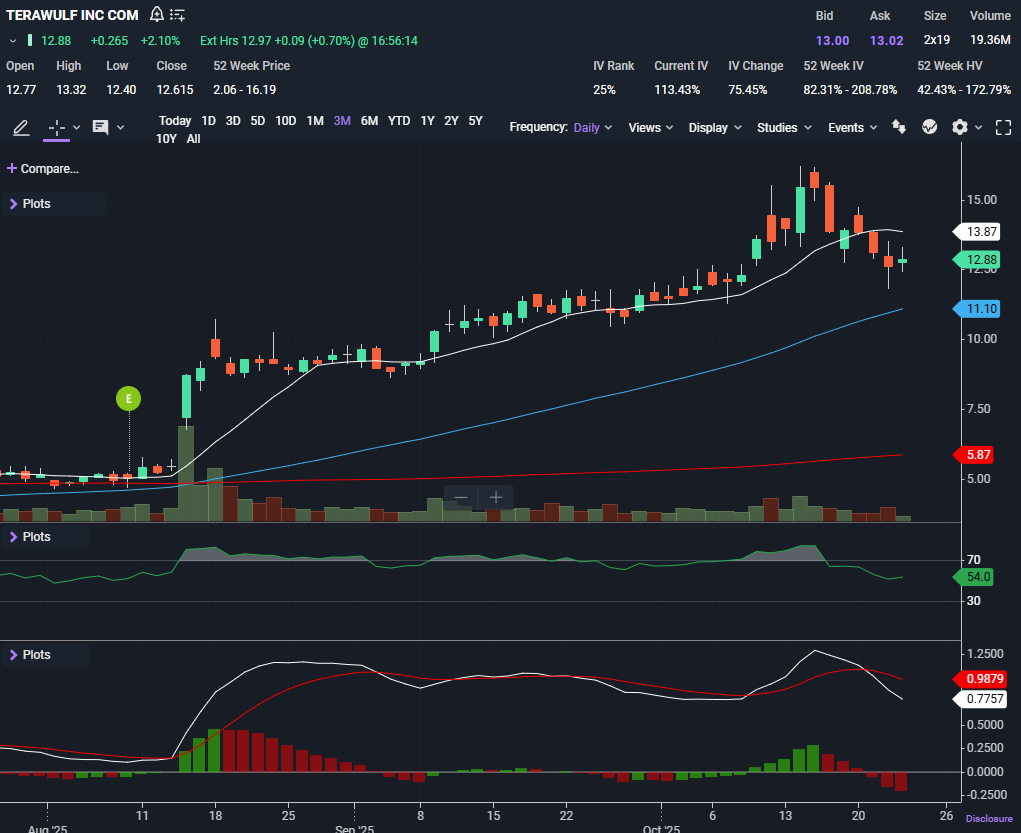
Here’s what I’m seeing when I look at the chart — Thursday’s close was $12.88, with a nice intraday bounce and follow-through in after-hours to $12.97.
After that early October pop to the mid-$15s, WULF pulled back and tested the 10-day SMA ($13.87) from below before stabilizing right above the 50-day SMA ($11.10). That’s healthy consolidation after a big run — not a breakdown.
Candlestick-wise, the last few sessions are showing what looks like a controlled pullback followed by stabilization. The higher lows forming just above $12.50 hint that buyers are starting to nibble again. Volume also tells a story — the spike into the initial rally came with heavy participation, but now we’re seeing it taper off as the stock digests the move. That’s often where sellers dry up and premium selling starts to shine.
🔍 Indicators
RSI: 54 — Right in neutral territory. Neither overbought nor oversold, meaning there’s room for movement both ways. That’s exactly the kind of balanced zone I like to see before initiating a short put because it reduces the chance of catching a falling knife.
MACD: Momentum cooled off after a strong rally, with the MACD line now below the signal. The histogram’s been shrinking, suggesting the pullback may be nearing exhaustion. I’ll take that — it tells me sellers are losing steam.
⚙️ Support and Resistance
Support: $12.00 → key psychological level and where I’ve anchored my trade logic. Below that, the next major level is around $11.10 (50-day SMA).
Resistance: $13.87 (10-day SMA)** — if price reclaims that, it opens the door back toward $15.00.
This kind of setup — support close by, resistance a bit higher — creates a great risk-to-reward window for selling premium. I’m keeping my strike below the support zone to give myself a cushion while still collecting a solid return.
💰 How I’m Trading It
Keep reading with a 7-day free trial
Subscribe to The Options Oracle to keep reading this post and get 7 days of free access to the full post archives.