
🛡️ $KLAC: Strong Trend, Tight Range — Where I’m Looking Next
💡Daily Trade Idea –Friday, Aug. 8, 2025 – $KLAC Trade Setup and Technical Breakdown

Hey traders and investors—
Today I’m walking through $KLAC off the live chart, showing you exactly how it’s setting up right now. We’ll hit price action, the key technical levels, and the indicators that matter. Then I’ll lay out three ways I’d look to trade it — one short-term, one long-term, and an options trade I’ve taken that fits this chart.
📰 Quick Rundown
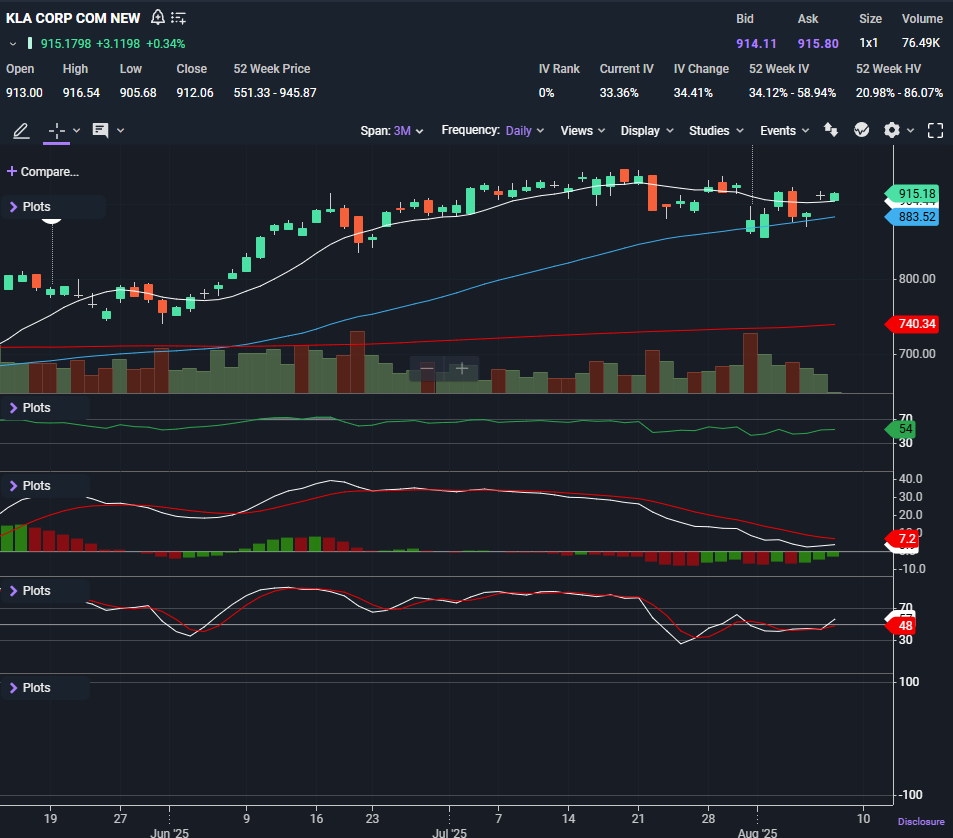
$KLAC is trading at $915.18 after a modest gain this morning. The stock has been in a steady uptrend for months, pulling back in late July before finding its footing above the 50-day SMA.
The semiconductor group just got a policy tailwind after news that companies committing to domestic production will be exempt from the 100% import tariffs. While some chip names have been volatile, KLAC’s reaction has been quieter — holding firm rather than breaking out aggressively.
This is a slow grind higher, not a rip-your-face-off rally, which actually makes it easier to plan entries and stops.
📉 Technical Breakdown
🔹 Price Action & Candlesticks
KLAC broke above the 10-day SMA and he last few daily candles show higher lows and closes holding above the 50-day SMA — a bullish sign for trend continuation. Today’s candle is green, with price pushing closer to the recent highs.
This is controlled buying — no panic spikes, just steady accumulation.
🔹 Moving Averages
10-day SMA: $904.44 → Acting as dynamic support in the short term
50-day SMA: $883.52 → The floor for medium-term trend traders
200-day SMA: $740.34 → Way below, confirming strong long-term uptrend
KLAC is trading above all three key SMAs — textbook bullish structure.
🔹 Indicators
RSI: 54 → Mid-range, leaning bullish. There’s plenty of room to run before overbought levels.
MACD: → Positive and flat, with a tightening spread — momentum is steady but not explosive.
Stochastics: 48 → Neutral, curling slightly higher. Suggests the next push could test recent highs.
