
🧠 Meta Bets Big on Superintelligence
A Blowout Quarter Overshadowed by Market Turmoil — What Comes Next for $META?

Hey everyone —
For today’s Weekend Deep Dive, I’m turning the spotlight on Meta Platforms Inc. ($META). The company delivered one of the strongest earnings reports of the season this past week — blowing out expectations and solidifying its AI leadership — but you wouldn’t know it by looking at Friday’s candle.
That’s because Friday wasn’t about Meta.
The entire market got slammed. The Nasdaq dropped 2.2%, the S&P 500 fell 1.7%, and investors ran from risk. Meta got caught in the downdraft. But from a technical and fundamental standpoint, this name is still one of the strongest on the board — and worth a close look.
In this breakdown, I’ll walk you through the chart step by step and share the trade setups I’m watching right now — whether you’re a short-term trader or a longer-term investor.
Let’s break down what just happened, why it matters, and how the chart is setting up now.
📰 What’s the Story?
Meta’s Q2 2025 results were nothing short of phenomenal:
Revenue: $47.5 billion (+22% YoY)
EPS: $7.14 (+38% YoY)
DAUs across Family of Apps: 3.48 billion (+6% YoY)
Ad Impressions: +11%
Average Price Per Ad: +9%
The company’s core advertising engine is on fire, and it’s being supercharged by AI innovations like:
Advantage+ (real-time ad placement optimization)
Andromeda (content relevance and engagement boosting)
GEM (Global Engagement Model) (predictive behavior modeling)
These tools are delivering better results for advertisers, and it’s showing up in the numbers. On top of that, Meta reported strong early monetization for Threads, which has grown to 320M MAUs.
But what really stood out was Meta’s AI infrastructure push. In Q2 alone, they spent $17 billion in capex — a 101% increase year over year — building out data centers and server networks. They're now projecting $66–$72 billion in capex for FY25, with even more growth planned for 2026.
A big chunk of that is headed toward the new Meta Superintelligence Labs, co-led by high-profile names like Scale AI’s Alexandr Wang. The lab is focused on creating next-gen personal superintelligence tools, likely built on their Llama framework — with ambitions that stretch across social, search, wearables, and beyond.
That kind of investment is a double-edged sword — it raises growth potential, but it also demands trust. And while Reality Labs (AR/VR) continues to burn cash with another $4.5 billion operating loss, Meta’s total cost discipline is holding together, with only a 12% YoY increase in total expenses.
So why did the stock drop Friday?
It didn’t have much to do with Meta. The market-wide selloff dragged everything down, especially high-beta names like $META. But the underlying story here is still rock solid, and the chart reflects that — if you know what to look for.
📈 Technical Breakdown
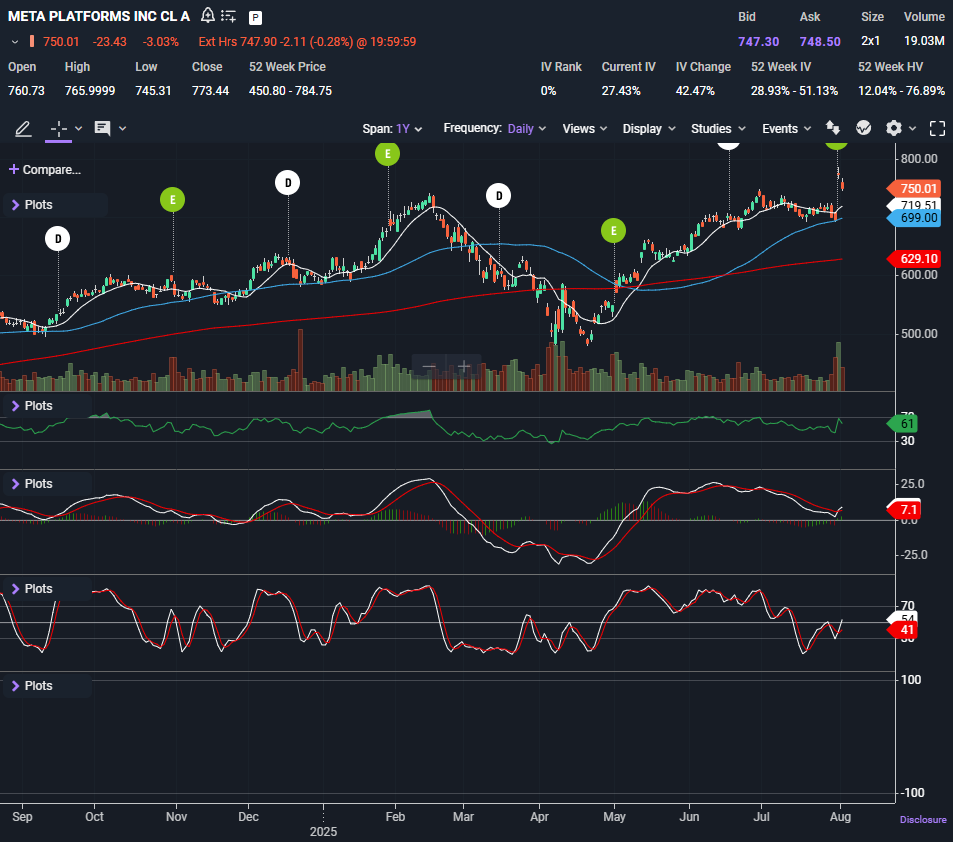
Let’s walk through what Meta’s chart looked like at Friday’s close: $750.01, down -3.03% on the day.
🔹 Price Action & Candlesticks
After the blowout earnings, Meta gapped up post-market on Wednesday and surged as much as 9%. But by Friday, it printed a bearish candle, giving back those gains and closing near the low of the day.
That sounds ugly — and technically, it is a near-term reversal pattern — but again, this wasn’t Meta-specific selling. It was macro-driven. Still, from a trading standpoint, it’s a signal we can’t ignore.
🔹 Moving Averages
10-day SMA: $719.51
50-day SMA: $699.00
200-day SMA: $629.10
Price is still well above all three major SMAs, which tells us the long-term trend remains firmly bullish. If it pulls back further, the 10-day and 50-day are going to be critical bounce zones.
🔹 RSI: 61
Solidly in neutral territory. RSI was pushing overbought before Friday but is now cooling off. It’s not flashing a warning — it’s just showing that momentum paused.
🔹 MACD
The MACD line remains above the signal line, and the histogram is still positive, confirming bullish momentum. However, the most recent histogram bar has started to shrink, suggesting that the strength of the move may be fading slightly. This doesn’t signal a reversal yet, but it’s worth watching closely — especially if price tests support early next week.
🔹 Stochastics: 41
Rolling over again. It didn’t get a chance to stretch back into overbought territory before reversing, which supports the idea that we might see some choppy consolidation before the next move.
