
📱 META Holding the Line: Is the Next Move Up?
💡Daily Trade Idea–Friday Sept. 12, 2025 – $META Trade Setup and Technical Breakdown

Hello traders and investors,
Today I’m breaking down META Platforms Inc. ($META). This tech giant has been holding strong around key moving averages, and I want to show you how I’m reading the chart, where I see the setups for both short-term traders and long-term investors, and the options trade I set up.
📰 The Story
META has been trending sideways after its recent run, showing resilience even as broader tech has cooled a bit. Online chatter is split: some traders see consolidation as a base for another leg higher, while others worry about waning momentum. The way the stock is respecting support levels tells me buyers are still in the game.
📉 Technical Breakdown
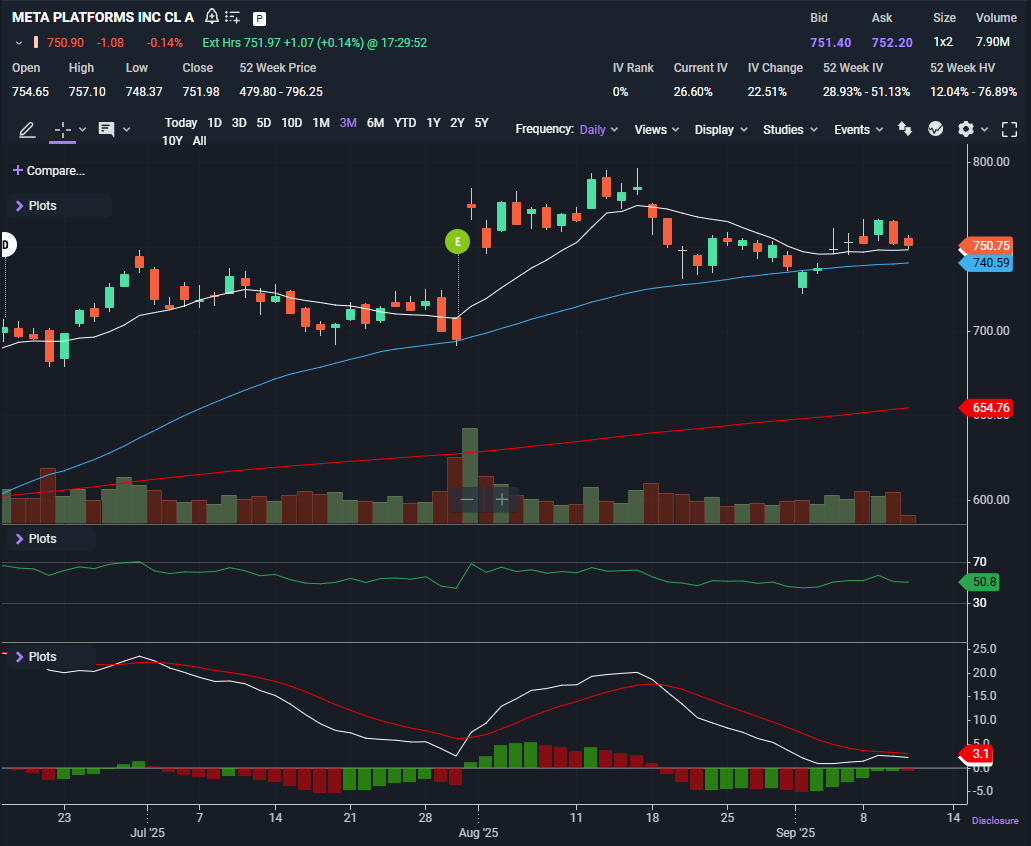
Price Action: META closed at $750.90 after a tight session. The candles show balance between bulls and bears, but importantly, no heavy selling pressure.
Moving Averages:
10-day SMA: $748.56 → price is just above, signaling short-term strength.
50-day SMA: $740.59 → holding as key support.
200-day SMA: $654.76 → well below current price, confirming long-term uptrend.
Candlesticks: Recent bars show controlled consolidation, not breakdown.
Pattern: Looks like a base forming after a recent rally, potentially setting up for a continuation.
📊 Indicators
RSI: 50 — sitting in neutral territory. This tells me META has room to move in either direction, with no immediate overbought pressure.
MACD: — still positive, though momentum has cooled. As long as MACD stays above zero, bias remains bullish.
🎯 Trade Setups and My Take
Keep reading with a 7-day free trial
Subscribe to The Options Oracle to keep reading this post and get 7 days of free access to the full post archives.