
Rivian Floors It: A Technical Dive into Friday's Explosive Breakout
Rivian smashes through resistance—where does it go from here?

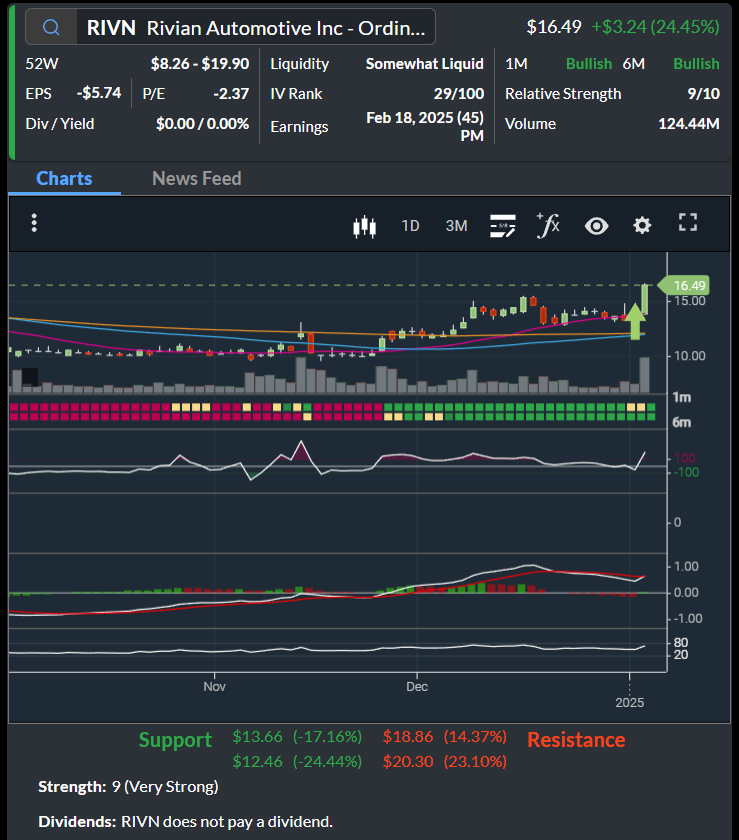
Hey traders and investors, welcome to this week’s deep technical analysis dive! Today, we’re spotlighting Rivian Automotive (RIVN), which absolutely floored it in Friday’s session with a stunning 24.45% gain.
Before we dive into the nitty-gritty technicals, here’s a fun backstory: my cash-secured put scan flagged Rivian a couple of weeks ago, which made me keep it on my watchlist. While I didn’t publish this specific scan result and unfortunately didn’t make a play it feels great to see the stock living up to its potential and rewarding those keeping tabs on it.
On Friday, Rivian hit its best levels since July, fueled by better-than-expected Q4 production and delivery numbers. So, what exactly is driving the stock higher, and more importantly, what does the chart tell us about its next moves? Let’s break it all down.
Why Rivian’s Fundamentals Ignited the Rally
Rivian crushed market expectations for Q4 deliveries and production:
Q4 Deliveries: 14,183 vehicles (above market expectations of under 14,000).
FY24 Deliveries: 51,579 vehicles (beating the high end of guidance at 50,500-52,000).
Supply Chain Headwinds Cleared: A key Enduro motor component shortage is no longer constraining production, removing a major overhang.
This news flipped sentiment on Rivian’s potential heading into 2025. Combine that with a big-picture story of strong cash reserves ($6.7B) and a lucrative Volkswagen joint venture ($5.8B in potential proceeds), and it’s clear why the market is feeling bullish.
But all of that is context. The real star of this story is the chart.
RIVN Technical Analysis: What the Chart Tells Us
1. Key Breakout Levels and Volume
Breakout Above $13.66 Resistance: Friday’s breakout past $13.66 was pivotal, flipping this former resistance into a new support level. Breakouts above key levels signal bullish momentum, especially when supported by volume.
Volume Surge: Rivian traded 124M shares on Friday, significantly above average, confirming strong institutional and retail buying interest.
Next Resistance Levels: The chart shows overhead resistance at $18.86 and $20.30. These levels could be where the rally pauses or consolidates.
2. Momentum Indicators
Relative Strength Index (RSI):
The RSI is shown on the chart and is nearing overbought territory (typically above 70). This reflects the stock’s strong bullish momentum but also suggests it might be due for a short-term pullback or consolidation.
Why It Matters: A rising RSI confirms the strength of the breakout, but near-term overbought conditions warrant caution for those looking to enter at these elevated levels. Overbought doesn’t mean a reversal, but it does signal that the stock is extended.
Commodity Channel Index (CCI):
The CCI showed a recent dip within the broader bullish trend, signaling a potential buying opportunity prior to Friday’s breakout. This is a classic pattern where a dip in momentum during a strong trend leads to an upward surge.
With the CCI now rising, it reinforces the bullish sentiment, though traders should watch for signs of overextension.
Moving Averages:
Rivian’s price is trading well above its 20-day, 50-day, and 200-day moving averages, all of which are trending higher. This alignment confirms the stock is in a strong bullish phase.
3. Support and Resistance Levels
Support Levels:
$13.66 (new support): A pullback to this level could be an ideal entry point for those looking to buy into strength.
$15.00 (short-term intraday support): If the stock pulls back slightly, this level might offer a more aggressive entry point.
$12.46 (secondary support): If sentiment reverses, this level becomes a deeper buying zone, but only for long-term bulls.
Resistance Levels:
$18.86: First resistance. A breakout above this level could bring momentum traders back into the stock.
$20.30: Major resistance. This level might act as a psychological barrier or profit-taking zone.
4. Implied Volatility (IV) Rank
With an IV Rank of 29, options are relatively cheap, favoring bullish strategies like long calls or debit spreads. If you prefer selling premium, you might want to wait for IV to increase.
Potential Entry Points and Play Ideas
If you’re watching Rivian for a potential trade, here are a few scenarios based on the chart:
1. Pullback to Support at $13.66
Why This Matters: Pullbacks to new support levels after a breakout often offer a low-risk entry point. If Rivian retraces to $13.66, you could use that as an entry with a stop slightly below.
Stop Loss Idea: Set stops around $13.00, just below the breakout zone to avoid getting shaken out by noise.
2. Momentum Continuation Above $18.86
Why This Matters: A breakout above $18.86 would confirm continued strength and could attract more momentum traders. Use a tight stop below $18 if entering here.
Target: $20.30 resistance, with a potential push higher if sentiment remains bullish.
3. Scaling In Around $15.00
Why This Matters: For aggressive traders, $15.00 could act as intraday support. Scaling in here with smaller positions might offer a decent risk-reward if the stock holds above this level.
What to Watch Moving Forward
While Rivian’s story and technicals are compelling, here are some potential risks and considerations:
Volatility Risk: Stocks that move 22% in a day often consolidate or retrace. Be prepared for short-term turbulence.
Earnings Risk: Rivian reports earnings on Feb 18. While that’s over a month away, earnings season can bring volatility, especially for growth stocks like Rivian.
Macroeconomic Concerns: With the Fed signaling limited rate cuts in 2025, financing costs might weigh on Rivian’s target market, as its vehicles lean on higher price points.
Final Thoughts
Rivian’s breakout on Friday was more than just a reaction to good news—it was a textbook technical move that rewarded traders who had been watching key levels. Whether you’re playing pullbacks, breakouts, or just sitting on the sidelines, Rivian’s chart provides plenty of setups worth considering.
As always, this isn’t financial advice—just ideas to fuel your trading strategy. Do your own due diligence, stick to your plan, and manage your risk. Let me know what you think of Rivian and if it’s on your radar for 2025. Until next week, happy trading! 🎯-EC
*Disclaimer The examples in The Options Oracle are my opinion, not financial advice.
Looking For More Trade Ideas? Follow Me on Twitter / X at EdwardCoronaUSA