
🔥 Tariff Panic Hit Stocks — Here’s Why I’m Leaning In, Not Out.
💡Daily Trade Idea – Monday Oct. 13, 2025 – $SOUN Trade Setup and Technical Breakdown

Good morning traders and investors — we’re kicking off the week with a name that’s been on my radar for a while: SoundHound AI (SOUN). This stock’s been one of the more volatile plays in the AI space, but that’s what makes it interesting.
Friday’s selloff across the market wasn’t about SOUN specifically — it was a broad-based risk-off move triggered by renewed tariff headlines, which hit growth and AI stocks especially hard. That’s exactly the kind of shakeout I look for — where price takes a hit for reasons that aren’t tied to fundamentals.
Today, I’ll break down what’s going on with SOUN, walk you through what I’m seeing on the chart, and lay out three setups — a short-term position trade, a long-term investor play, and the cash-secured put I’m personally placing.
📰 The Story & Sentiment
SOUN has been a retail favorite in the AI trade this year, and for good reason — it’s a pure play on AI-driven voice recognition and automation, which continues to grow fast.
Friday’s selloff was market-driven, not SOUN-driven. The company itself is coming off a strong Q2 earnings report, where revenue grew more than 200% year-over-year and management raised full-year guidance. Those numbers are what I pay attention to — not one bad red candle on a tariff headline.
In short: the long-term story remains bullish. Traders panicked, algorithms dumped momentum names, and SOUN just got caught in the crossfire.
📊 Technical Breakdown
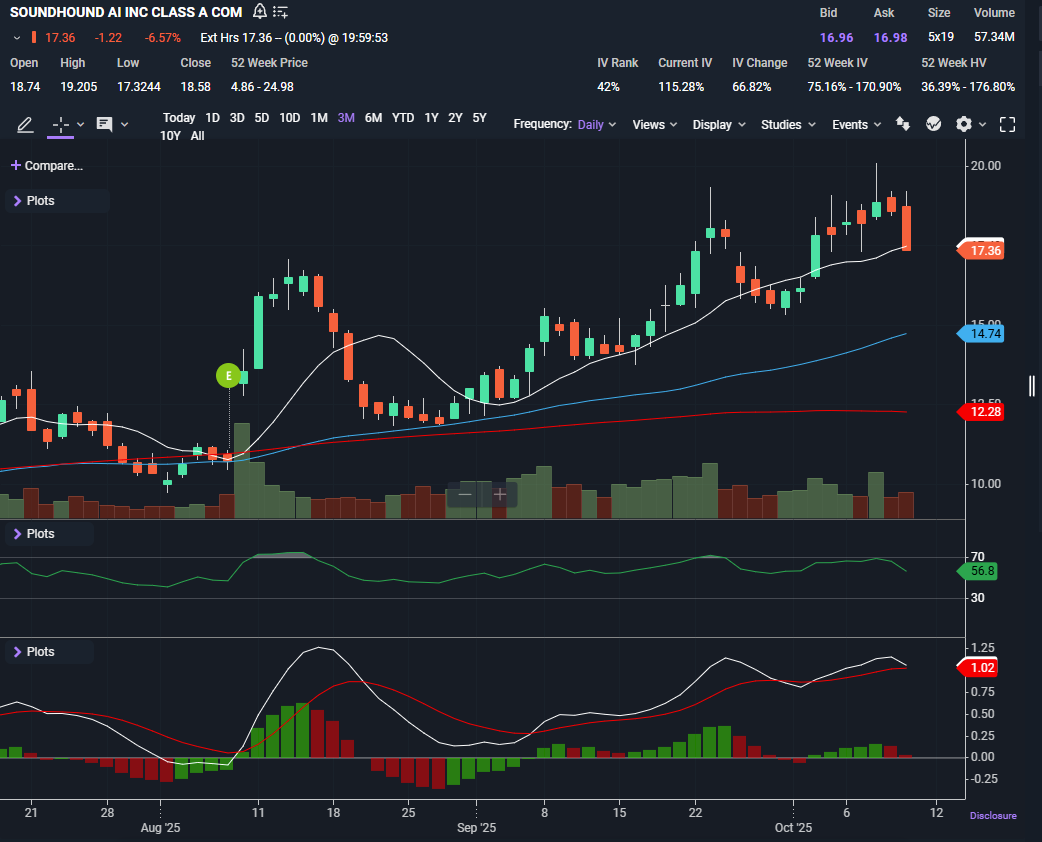
Price closed Friday at $17.36, pulling back just below the 10-day SMA ($17.40) but still well above the 50-day ($14.74) and 200-day ($12.28).
That’s a healthy overall chart structure if you take out Friday — short-term heat, but medium-term strength. SOUN’s been in a clear uptrend since late August, and dips toward the 50-day have consistently been bought.
If the broader market stabilizes early this week, I’d expect SOUN to find support quickly near that $17.00 area.
📈 Indicators
RSI: 56 — Mid-range, cooling off from recent highs. This suggests consolidation, not breakdown.
MACD: Still bullish, with the histogram narrowing slightly after a multi-week climb.
Momentum’s still in control here.
