


🏠Toll Brothers: Strong Foundation, Big Ceiling Is $TOL Ready to Run?
What the Chart Says—and How I’d Trade It from Here

Hello traders and investors,
Today I’m digging into Toll Brothers ($TOL)—a name that’s been quietly pushing higher and just might be lining up for a bigger move. This one caught my attention not just because of the chart, but because of what’s going on behind the scenes: a strategic CFO transition, strong recent earnings, and a well-managed luxury builder navigating a tricky housing backdrop better than most.
I’ll break down everything I’m seeing technically and explain how I’d trade this as both a short-term swing and long-term investment. I’ll walk through all the price action and indicators, keep it real, and point out where the risk and opportunity sit.
📰 Quick Story: New CFO, Same Game Plan
Toll Brothers recently announced that Gregg Ziegler will take over as CFO on October 31, 2025, replacing long-time finance head Marty Connor. And while that kind of leadership change could spook some investors—especially in a rate-sensitive sector like homebuilders—this one feels different.
Ziegler’s been with TOL since 2002, working his way up through capital markets, M&A, strategy, and most recently as Treasurer. His appointment signals continuity, not disruption. The market seems to agree—there was no selloff on the announcement.
And that comes on the heels of a strong Q2 earnings beat back in May. The company delivered 2,899 homes and $2.71B in revenue—well ahead of expectations. Margins are tight because of affordability issues and incentives, but they’re staying focused on returns over raw margin percentage.
With interest rates still weighing on sentiment, Toll’s diversified luxury mix—affordable luxury (45%), true luxury (35%), and age-targeted (20%)—gives it flexibility across markets. So while 3Q guidance came in a bit soft, the long game still looks intact.
Now let’s see if the chart agrees.
📊 Chart Breakdown:
📈 Price Action & Candlesticks
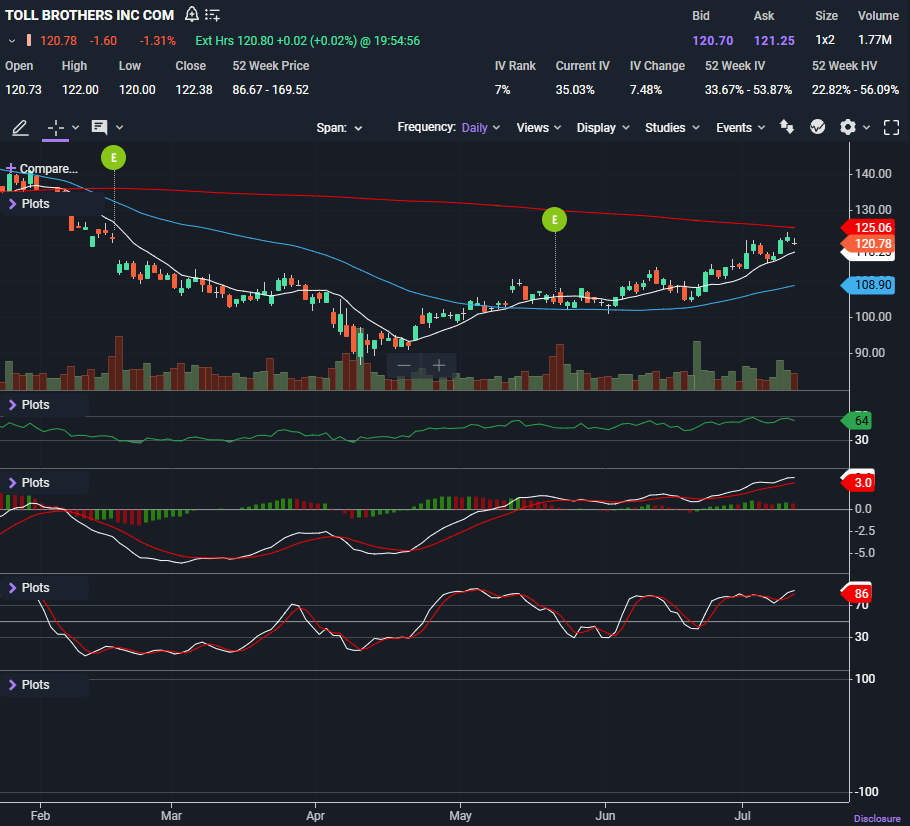
TOL closed Friday at $120.78, down just a bit after a strong multi-week run. This chart has been trending steadily higher since early May, building a staircase of higher lows with increasing momentum.
The most notable thing here? It’s approaching long-term resistance at $127.26, and Friday’s action shows a slight pullback right below that level after a clean breakout above the 200-day SMA earlier in the week.
This looks like a healthy pause, not a breakdown—at least for now.
🔁 Moving Averages (Simple)
10-day SMA (white): Riding just below price around $120, offering near-term support.
50-day SMA (blue): Sits around $108.90—a key spot buyers defended back in June.
200-day SMA (red): $125.06, overhead. This is the key level right now.
✅ Price is steadily climbing toward the 200-day SMA at $125.06, but it hasn’t tested it yet. If bulls can push through that level next week with volume, it could trigger a breakout. If it stalls here, I’ll be watching how it reacts near the 10-day for signs of weakness
📈 Indicators
RSI: 64
This is right in the sweet spot. We’re not overbought yet, but we’ve got room. RSI above 60 in a rising trend is often a sign of strength—not exhaustion.
MACD: Bullish (3.0 / rising)
MACD is above zero and still widening from the signal line. Momentum is healthy. As long as this holds, buyers have control.
Stochastics: 86
This is in overbought territory, but in a steady uptrend, that’s not a sell signal—it’s more like a flag to watch for cooling off. Could lead to some sideways action, but not necessarily a reversal.
Volume
Nothing explosive lately, but volume has been steadily rising over the last three weeks. That supports the breakout effort.
🧱 Support & Resistance Levels
Support Zones:
$116.26 (-3.74%)
$108.90 (50-day SMA)
$97.26 (-19.47%)
Resistance Zones:
$125.06 (200-day SMA)
$127.26 (5.37%)
$168.41 (39.44%) — previous all-time high, a long shot but notable if this turns into a longer breakout
🛠️ How I’d Trade It
Here’s how I’d approach this name—two lanes depending on your style.
Keep reading with a 7-day free trial
Subscribe to The Options Oracle to keep reading this post and get 7 days of free access to the full post archives.