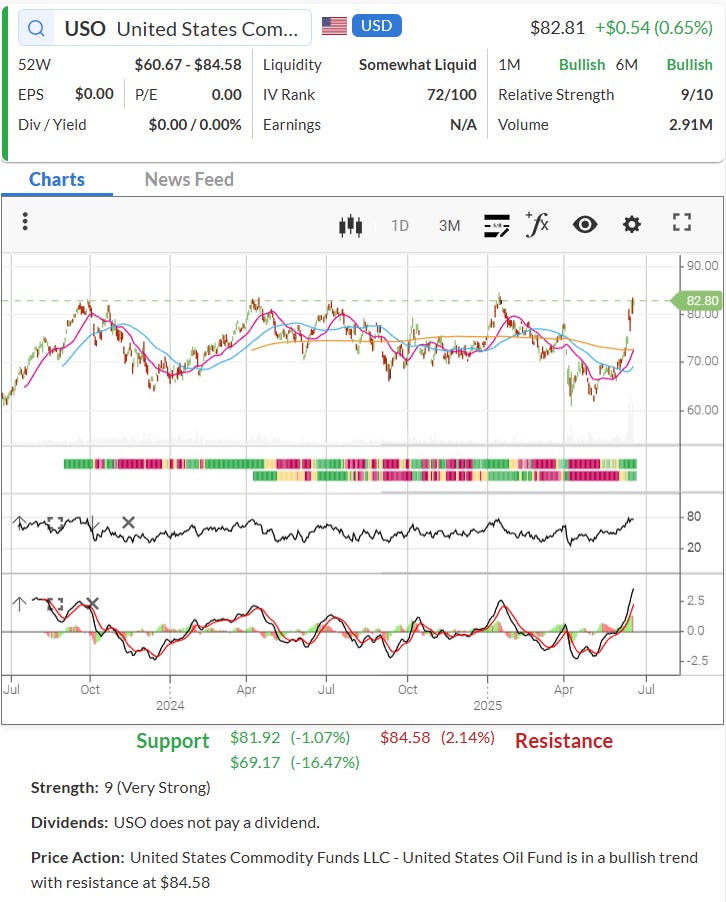
💡Trade Idea – Fri 6/20/25 🛢️ Deep Dive: $USO
Breaking Down the Move in Oil — And How I’d Trade It
Hey traders and investors,
Let’s talk oil — and more specifically, $USO (United States Oil Fund). It's not the sexiest ticker on your watchlist, but it’s a solid proxy for crude oil prices and it's been making some interesting moves lately.
I’m going to break this chart down and show you exactly how I see it. Whether you're an investor, a position trader, or an options trader, I’ll walk you through how I’d approach $USO based on what the chart is telling us right now.
🧪 The Setup: Why $USO?
USO tracks the daily price movements of WTI crude oil via front-month futures. It's not perfect — futures roll can distort things — but it’s still one of the easiest ways to get exposure to oil without trading futures directly.
Crude oil has been rebounding after some heavy geopolitical pressure and supply disruptions. With summer driving season in full swing and hurricane season heating up, the price of oil tends to get more volatile. That makes $USO a pretty interesting play for traders right now.
📊 Chart Breakdown: What I’m Seeing
Let’s dig into the technicals.
🔹 Price Action
$USO is trading at $82.81, just under resistance at $84.58. That’s the top of a major range going back to late 2022. A clean break above that could open the door for a push toward the $88–$90 zone. On the flip side, it’s also a spot where sellers have stepped in before.
We’ve already seen a strong rally off the lows around $69.17, and it blew right through both the 50-day and 200-day moving averages, which is a bullish signal. That kind of power usually tells me buyers are in control.
📈 RSI (Relative Strength Index)
RSI is climbing and is above overbought levels — not a reason to sell, but definitely a reason to watch, stocks in a bullish trend can stay at overbought levels for a while.
🔁 MACD
MACD just crossed bullish and is accelerating higher — that’s a strong signal that momentum is building. I like seeing this confirm the price move. If it flattens out near the highs, I’ll start looking for divergences or weakness, but for now, it's strong.
📉 Volume & Trend Strength
Volume is solid, and Trend Strength is a 9/10 — this isn’t a quiet mover anymore. It’s attracting attention.
🧠 Trade Ideas Based on This Chart
Here’s how I’d approach $USO depending on your style, Trader, Investor, Options Trader:
Keep reading with a 7-day free trial
Subscribe to The Options Oracle to keep reading this post and get 7 days of free access to the full post archives.


