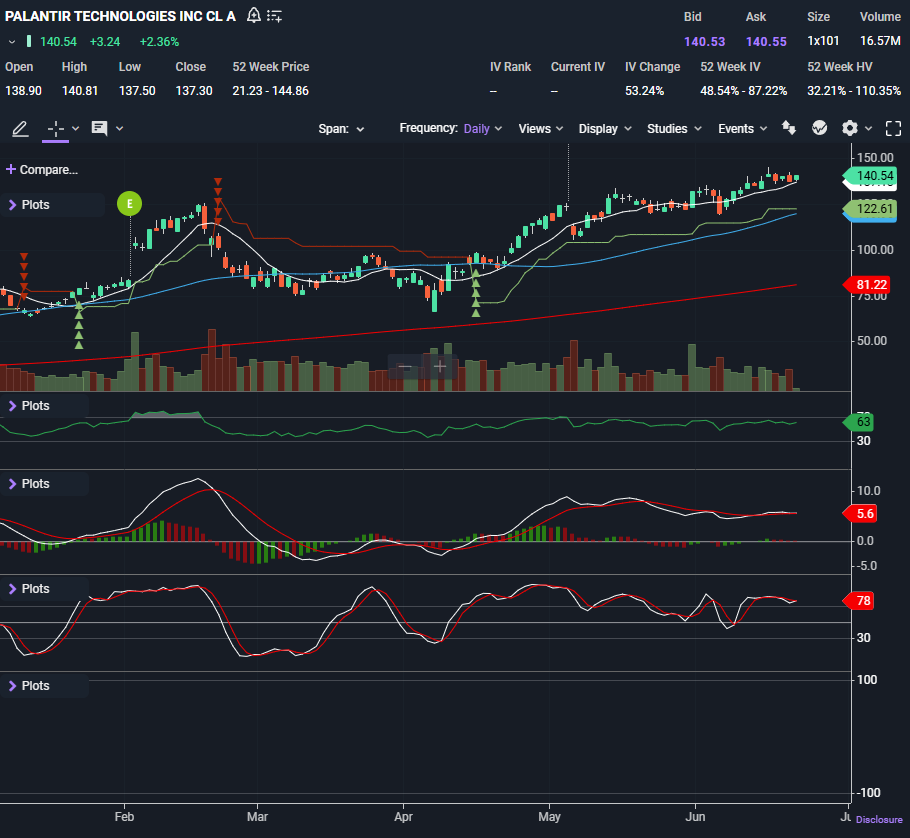
💡Trade Idea – Mon 6/23/25 Palantir Holding Steady — Is a Breakout Coming?
How I'm Looking to Play $PLTR today — Investor, Position, and Options Trade
Hey traders and investors,
Let’s talk about Palantir Technologies Inc. ($PLTR). This stock has been one of the consistent winners in the AI space, and right now it’s setting up in a tight range that could explode either way. This kind of chart always gets my attention — strong trend, well-defined levels, and momentum indicators starting to stir.
The company’s been landing more AI-related contracts with both government and commercial clients, and they're positioned as a backbone data infrastructure player as AI adoption spreads. It’s not just hype — Palantir’s becoming the operating system for a lot of real-world AI applications.
🔍 First, the Big Picture
$PLTR closed at $140.54, putting it just below a key resistance level at $144.86. That’s the ceiling I’m watching closely. The stock’s been moving in a healthy range, with clear support sitting down at $135.23, and if that breaks, the next big floor is around $128.23. These are clean, tradable levels — and that’s what I like.
It’s holding its trend, but we need to see if this coil resolves higher or starts to unwind.
🧭 Price Action and Moving Averages
Price is riding well above the 9-day and 21-day EMA, and still trending cleanly above the 50-day moving average. This is a textbook bullish setup — steady, higher lows, and zero signs of breakdown.
The 21-day EMA at $122.61 continues to act like gravity — price respects it but hasn’t tested it in weeks. As long as we stay above $135, I like this chart for continued upside.
💡 RSI: No Overbought Signals
The RSI is sitting at 63 — strong, but not overheated. That tells me buyers are in control without frothy levels. This is what a base under resistance looks like when bulls are patiently accumulating shares.
If RSI pushes above 70 while price breaks resistance, I’d expect momentum traders to pile in.
📉 MACD: Still Leaning Bullish
The MACD is flat but still above the signal line, and histogram bars are hugging the zero line. This isn’t explosive momentum — yet — but the bulls haven’t lost control either. It’s more of a “calm before the move” look.
What I’m watching for: a bullish MACD crossover with a strong green bar on volume would be confirmation of a breakout move.
🔁 Stochastics: Overbought but Drifting
The Stochastic Oscillator is still hovering around 78, just under overbought territory. It’s not rolling over yet, and it’s been sticky up here for a few sessions. That’s bullish, but I wouldn’t get long aggressively unless we break out with confirmation.
This is one of those moments where we wait for the tape to tip its hand.
🧮 Volume: Light, but Still Constructive
Volume’s been relatively light through this consolidation phase. That’s not a red flag on its own — especially since price is holding trend — but I’d love to see a volume spike come in on any breakout above $145. That would give the move credibility.
🎯 How I’d Trade It (Position, Investor, Options Trader)
Keep reading with a 7-day free trial
Subscribe to The Options Oracle to keep reading this post and get 7 days of free access to the full post archives.


