


💡Trade Idea – Mon. 6/30/25 Eli Lilly & Co (LLY)
Breaking Down the Chart and How I’d Trade It

Hey traders and investors —
Let’s kick off the week with a look at one of the heaviest hitters in biotech—Eli Lilly. I’ve been watching $LLY coil sideways for weeks now, and with the recent activity in the broader market and big pharma, I figured it was time to pull this one apart and see what’s really going on under the hood. I’ll break down the current setup and share how I’d approach this as a short-term trade, an investment, and an options play.
📰 What's New with Eli Lilly?
Eli Lilly has been in the headlines again thanks to ongoing developments around its blockbuster diabetes and weight loss drug, Mounjaro. There’s also growing investor interest tied to its Alzheimer's drug donanemab, which recently received backing from an FDA advisory panel. The market is clearly optimistic about the pipeline, but the stock hasn’t broken out—yet.
Despite positive drug momentum and a strong long-term fundamental story, the chart's been stuck in neutral. And that's exactly why I'm interested right now. It’s usually when things go quiet that you want to pay the most attention.
📊 Let’s Break Down the Chart
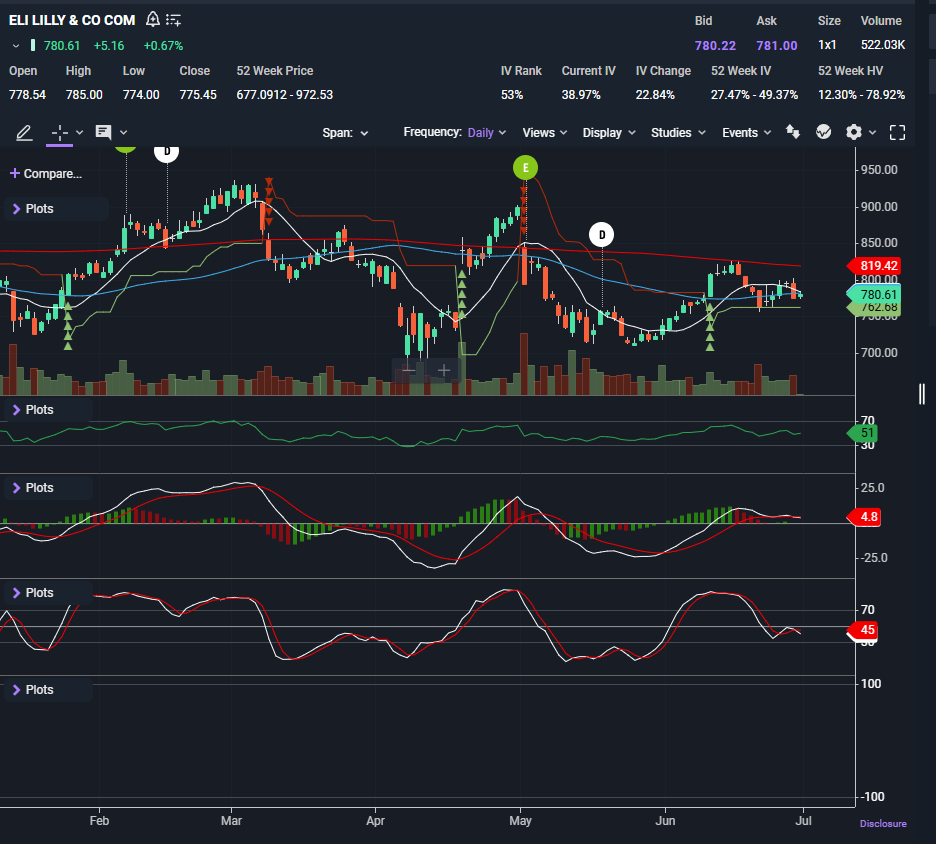
Price closed at $775.45 on Friday and has been chopping sideways since early June. Here’s what stands out to me:
Moving Averages:
The 10-day and 20-day SMAs are starting to converge just under current price. The 50-day is curling upward and has acted as soft support a few times over the past month. That’s a bullish tilt forming underneath.
But the 200-day? That’s still overhead at $819.42, acting like a lid. We’ve tested that zone twice and pulled back both times.Volume:
Pretty muted compared to the big move back in April. That’s a yellow flag. We want to see strong conviction if this is going to push through resistance. Without volume, moves higher might fizzle.MACD:
It’s flattened out after a strong uptrend. Still above the zero line, which leans bullish, but there's no clear momentum right now. I’m watching for either a bullish crossover or a bearish one to confirm the next leg.Stochastic RSI:
Sitting around 45 and trending sideways. That tells me we’re in the middle of a range and waiting for direction. No edge here yet.Relative Strength Index (RSI):
Reading 51 and also moving sideways. Again—neutral. It’s neither overbought nor oversold, so the stock has room to move in either direction.
🧭 Support and Resistance
Support Zones:
$750.00 – Near-term price shelf and the 50-day SMA
$722.00 – Stronger support with bounce history
$677.00 – Longer-term support and recent pivot low
Resistance Zones:
$819.00 – The 200-day SMA and repeated rejection zone
$850.00+ – Would signal a major breakout if cleared
🛠️ How I’d Play It
Let’s break it down by style: Position Trader, Investor and Options Trader
Keep reading with a 7-day free trial
Subscribe to The Options Oracle to keep reading this post and get 7 days of free access to the full post archives.