


💡Trade Idea – Wed 6/18/25 SBUX: Brewing a Move or Just Steaming Sideways?
Breaking Down Starbucks for Investors, Swing Traders, and Options Players

Hey traders and investors,
Let’s talk about $SBUX (Starbucks Corp).
We all know the brand. It’s basically the face of overpriced caffeine and lifestyle marketing. But lately, the stock hasn’t exactly been piping hot. After peaking last summer, it’s spent months cooling off—and now it’s hanging out right in the middle of the range. The big question now: is this consolidation just a pause before the next push higher… or is the stock losing its buzz?
Today I’m drilling into the chart, walking through the signals step-by-step, and laying out how I’d personally think about trading this whether you're:
📈 A short-term swing trader looking to catch a move,
💼 A long-term investor trying to build a position, or
💡 An options trader hunting for premium or directionals.
I’ll walk you through the chart and explain what I’m seeing, what matters, and how I’d set up a trade around it.
☕ The Backstory on Starbucks
Starbucks is a $100 billion global brand with over 38,000 locations worldwide. It’s more than just coffee—it’s a habit. They’ve got steady dividend growth, strong cash flow, and decent margins for a retail chain.
But the stock’s been through it this past year. It got crushed from the $110s all the way into the low $70s after weak comps in China, some messy union headlines, and margin concerns. Lately though, it’s been firming up—forming a bit of a rounded base.
Earnings are coming up on July 29th—so traders are starting to circle it again. This is where things start to get interesting.
🔍 Let’s Break Down the Chart
This thing’s been through a lot. But right now, price is back above the 20-day, the 50-day, and starting to flirt with the 100-day moving average. That’s a good sign—but it’s not out of the woods yet.
Here’s what I’m looking at:
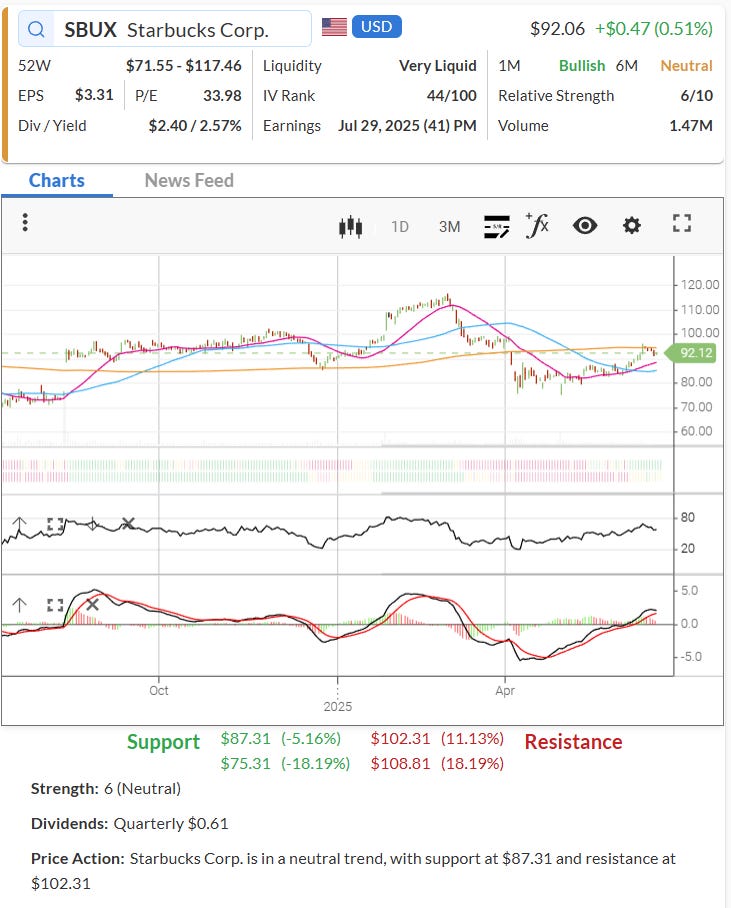
🟢 Support Zones
$87.31 — That’s the closest major support. Price bounced clean off that recently.
$75.31 — That’s the “uh oh” level. If it breaks here, you’re looking at a much bigger breakdown.
🔴 Resistance Zones
$102.31 — That’s the line in the sand. It tagged this area in March and got rejected hard.
$108.81 — That’s the next major supply zone. Unlikely to hit unless something changes drastically in earnings or guidance.
🧭 Moving Averages
Price is now above the 20-day EMA and the 50-day SMA—both curling upward slightly.
The 100-day is still overhead and slightly declining. If price can reclaim that and hold, you could get some momentum back.
📉 RSI
RSI is hanging around 55. That’s neutral—not oversold, not overbought. It confirms that we’re in a “wait and see” phase. No major divergence, but if it can climb toward 60+, that would suggest building strength.
🧠 MACD
The MACD just flipped bullish recently. The histogram is increasing and both lines are trending up above the zero line. That’s a momentum shift—could mean the start of a breakout, or just a short-term relief rally.
💡 How I’d Trade It:
Keep reading with a 7-day free trial
Subscribe to The Options Oracle to keep reading this post and get 7 days of free access to the full post archives.