
📈 Triple Moving Average Crossover: Bullish and Bearish Signals Explained
Finding the Sweet Spot in Your Trades

Hey, traders! 👋
Today, I’m drilling down on a strong trading strategy: the Triple Moving Average Crossover for both bullish and bearish setups. I have written articles about using moving averages to spot trends, but adding this triple layer gives us powerful insight into when the market is about to make a move—whether it’s heading up or down.
By the end of this, you’ll have a solid understanding of both setups and how you can use them to not only ride upward momentum but also profit when the market takes a nosedive.
What Is the Triple Moving Average Crossover?
The concept is straightforward: moving averages smooth out price data over a given period, helping us identify trends without getting whipsawed by the day-to-day noise. The Triple Moving Average Crossover adds a layer of sophistication by using three different time frames to signal either a bullish (upward) or bearish (downward) shift in momentum.
For both bullish and bearish setups, the moving averages we use are the same:
Short-Term Moving Average (e.g., 10-day)
Medium-Term Moving Average (e.g., 50-day)
Long-Term Moving Average (e.g., 200-day)
It’s the direction of the crossovers that tells us which way the market is likely headed.
Let’s break it down into the two strategies: bullish and bearish.
1. The Bullish Triple Moving Average Crossover
The bullish setup happens when a shorter-term moving average crosses above a medium-term moving average, and then both cross above a longer-term moving average. It’s like seeing the market gain steam step by step, with the short-term momentum leading the way, the medium-term following, and the long-term confirming the trend.
Example:
Let’s say you’re tracking a stock. You’re using the 10-day (short), 50-day (medium), and 200-day (long) moving averages. First, you see the 10-day cross above the 50-day—this signals that short-term momentum is building. Then, both the 10-day and 50-day cross above the 200-day. That’s the moment you’ve been waiting for! This is a clear signal that the stock is likely heading into a bullish uptrend, and it’s time to think about entering a trade, whether you’re buying shares or trading options.
Why It Works:
The triple crossover is a powerful setup because it gives us layers of confirmation. The short-term moving average reacts quickly to price changes, capturing recent momentum. The medium-term adds another filter, and the long-term gives you the ultimate confirmation that the trend is real and could last.
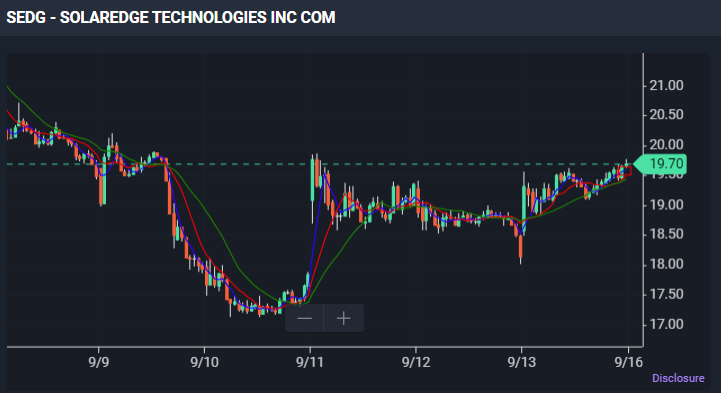
Commentary:
The 4-period moving average crossed above the 9-bar, which crossed above the 18-bar. This triggered a bullish event on 9/13. The price is likely in an established uptrend, when considering the timeframe of the moving averages (shorter-term moving averages smooth out shorter-terms.
I’ve used this strategy many times, and while no system is foolproof, it’s helped me catch some solid upward trends before they fully took off. It’s not about getting in at the absolute bottom—it’s about stacking the odds in your favor and entering with confidence.
2. The Bearish Triple Moving Average Crossover
Now, let’s talk about the bearish side of the strategy. While we all love riding bullish waves, being able to spot bearish trends is just as important—especially in a market that can turn on a dime. The beauty of the Triple Moving Average Crossover is that it works just as well when the market is heading down.
The Setup:
The bearish setup occurs when the short-term moving average crosses below the medium-term moving average, and then both cross below the long-term moving average. This signals a shift to downward momentum and is a clear sign that it might be time to short the stock, sell your positions, or look into buying put options.
Example:
Let’s take a stock, you’re watching the 10-day, 50-day, and 200-day moving averages. The first signal comes when the 10-day crosses below the 50-day. That’s your early warning sign that momentum is weakening. Then, both the 10-day and 50-day cross below the 200-day. That’s your big flashing red light, telling you that the stock is likely to enter a downtrend. Time to think about bearish strategies, whether that’s selling stock, buying puts, or even shorting.
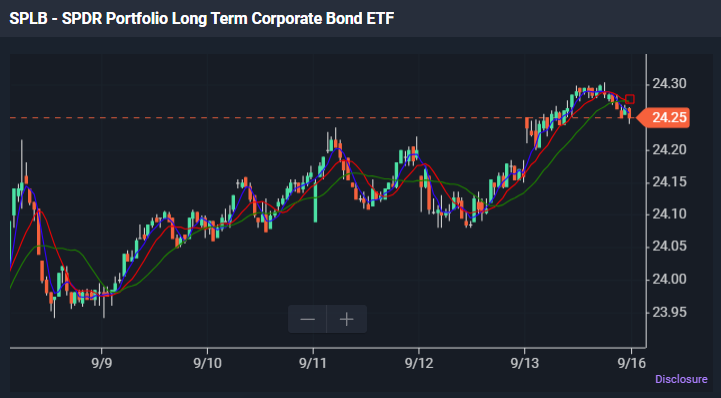
Commentary:
The 4-period moving average crossed below the 9-bar, which crossed below the 18-bar. This triggered a bearish event on 9/13. The price is likely in an established downtrend when considering the timeframe of the moving averages (shorter-term moving averages smooth out shorter-term
Why It Works:
Just like the bullish setup, the bearish Triple Moving Average Crossover gives you multiple levels of confirmation. It’s designed to help you avoid jumping the gun on every dip and focus on the real breakdowns in price action.
Timing Your Trades
Now that you understand both the bullish and bearish crossovers, you’re probably wondering about timing. The crossover itself is a strong signal, but I like to combine it with price action and maybe even a few other indicators, like RSI or MACD, just to confirm the move.
One thing I’ve learned is that patience pays off. After the crossover happens, you don’t always need to jump in right away. Sometimes I wait for a slight pullback or additional confirmation before entering a trade. This gives me a better chance to enter at a price that reduces risk.
Why This Strategy Fits Into My Playbook
I’m a big fan of strategies that help me stay disciplined, and the Triple Moving Average Crossover is a huge part of that. Whether it’s bullish or bearish, I rely on this setup to avoid making impulsive decisions based on short-term noise. It’s like having a built-in roadmap for spotting trends that are more likely to last.
And let me tell you, this strategy has saved me from plenty of bad trades over the years—especially in those choppy, sideways markets where false signals are everywhere. But when I see the crossovers line up, it gives me the confidence to either ride the wave or take cover before the storm hits.
My Take
Back in the day, when I was first learning the ropes, I didn’t always have systems like this in place. I would jump in and out of trades without enough confirmation, trying to catch the next big move. And yeah, sometimes it worked—but more often, I’d find myself on the wrong side of the trade, wishing I had waited for more evidence.
Now, with the Triple Moving Average Crossover in my toolkit, I don’t need to guess. I can wait for the signals to line up and feel confident knowing the trend is in my favor, whether I’m looking to profit from a bullish move or protect myself from a bearish drop.
Your Next Move
If you haven’t already started using the Triple Moving Average Crossover, I encourage you to test it out. Pull up a chart of a stock you’re interested in and add the three moving averages. Watch how they interact and see if you can spot both bullish and bearish crossovers. Trust me, once you start seeing the patterns, you’ll wonder how you ever traded without them.
And as always, feel free to drop your thoughts or questions below! I love hearing how these strategies are working for you all, so don’t hesitate to share your experience or ask for help. 👇
Until next time, Happy Trading -ec 🚀
*Disclaimer The information in The Options Oracle is my opinion, not financial advice.
Looking For More Trade Ideas? Follow Me on Twitter / X at EdwardCoronaUSA