
🚖 UBER – Fresh Setup Right Off the Watchlist
💡Daily Trade Idea –Tuesday, Aug. 12, 2025 – $UBER Trade Setup and Technical Breakdown

Hey traders and investors, if you’ve been following along, you know I just broke down Uber ($UBER) in Sunday’s deep dive. I said I was waiting for a clean technical setup to drop in with an options trade — and now, I got it. Here’s a fresh look at Monday’s closing chart and why this one checks the boxes for me right now.
What’s Been Going On
Uber’s been working its way through a summer pullback after hitting the high $90s in July. The drop cooled things off, but buyers stepped in near the mid-$80s, defending the 50-day SMA. Last week, we started to see momentum come back, and now price is stacking green candles again.
No major news catalyst today, but sentiment’s still leaning bullish — analysts have been sticking with overweight ratings, and options flow has been tilting to the call side. It’s not a screaming “go” signal, but the structure is setting up for a controlled move higher.
What the Chart’s Telling Me
Price & Candles:
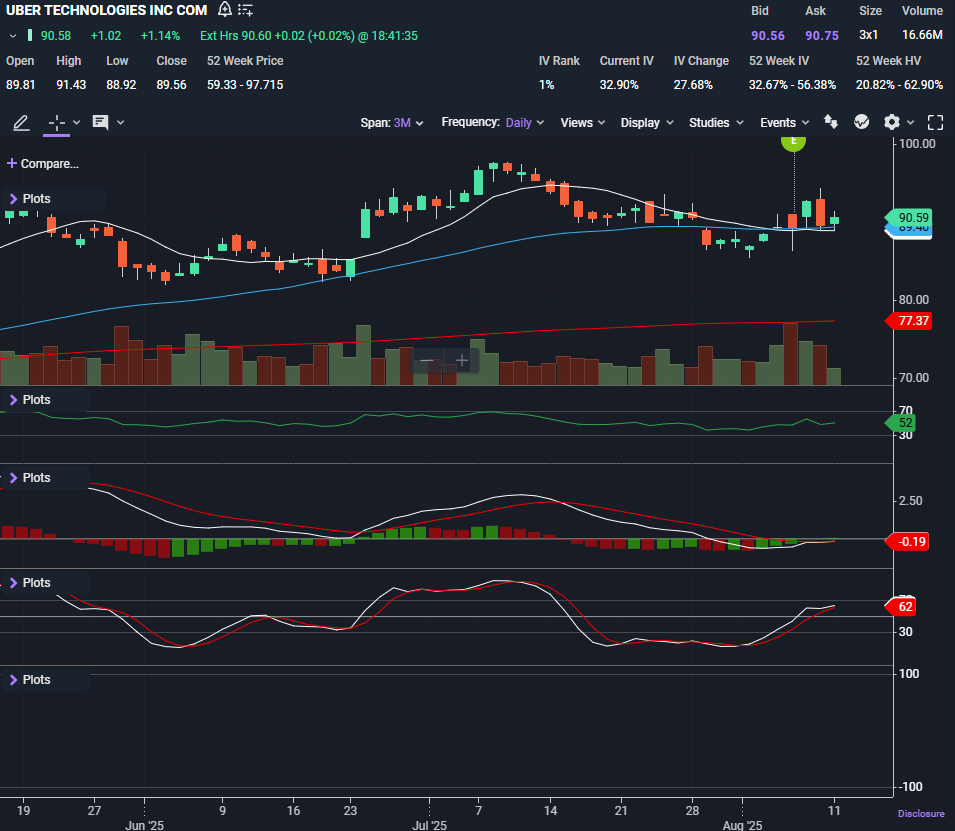
Closed Monday at $90.58, sitting above the 10-day SMA ($88.93) and 50-day SMA ($89.40), with the 200-day way down at $77.37. Price is pushing off last week’s bounce and holding short-term support.
Moving Averages:
10-day – acting as near-term support.
50-day – almost in line with the 10-day, creating a strong support cluster.
200-day – well below price, long-term trend intact.
Patterns:
No clean textbook pattern here — more of a mini-bounce-and-hold setup after a dip, with the potential for a trend continuation if it builds above $91–$92.
Indicators
RSI: 52 — mid-range, plenty of room before overbought.
MACD: Just flipped positive after a slow grind higher — momentum shift is on the table.
Stochastics: 62 — climbing but not overextended yet.
