
📈 Understanding the Commodity Channel Index (CCI)
The Hidden Power of CCI in Trading

Hello traders and investors! In the world of technical analysis, The Commodity Channel Index (CCI) is a versatile and effective tool often underappreciated by traders and investors. While the name might suggest it’s only for commodities, the CCI can be applied to all kinds of assets, including stocks, bonds, and currencies. In this article, I’ll break down what the CCI is, how to interpret it, and how you can integrate it into your trading strategy to improve your timing on entry and exit points.
📊 What is the Commodity Channel Index (CCI)?
The CCI is a momentum-based oscillator originally developed by Donald Lambert in 1980. It measures the deviation of an asset’s price from its historical average. When the CCI moves above or below certain thresholds, it suggests that an asset is either overbought or oversold, which can signal a potential reversal in price or the continuation of an existing trend.
Although the CCI was initially designed for commodities, it’s now widely used across various asset classes. Traders value the CCI because of its ability to highlight the early stages of a new trend and to indicate possible trend exhaustion.
🔍 How is the CCI Calculated?
The CCI calculation revolves around comparing the typical price (an average of high, low, and close prices) to a moving average of that typical price. Here’s the formula:
CCI = (Typical Price - Simple Moving Average of Typical Price) ÷ (0.015 × Mean Deviation)
Where:
Typical Price = (High + Low + Close) ÷ 3
Mean Deviation = Average of the absolute differences between the Typical Price and its SMA.
The constant value of 0.015 is used to ensure that around 70-80% of CCI values fall between -100 and +100, creating a useful reference range.
📈 Interpreting the CCI: Overbought, Oversold, and More
The CCI oscillates above and below a zero line. By convention, traders often use the following levels to guide their decisions:
+100: An asset is considered overbought or in a strong uptrend. This could be a signal to take profits or consider shorting (depending on other indicators).
-100: An asset is considered oversold or in a strong downtrend. This could be a signal to buy or take long positions.
But the true power of CCI lies in its flexibility. Here’s how you can use it in different market conditions:
📍 1. Identifying Overbought and Oversold Conditions
Above +100: If the CCI rises above +100, it suggests the asset may be overbought and that a downward correction or trend reversal might be near. Traders could consider this an opportunity to either lock in profits or even go short if other technical indicators align.
Below -100: If the CCI drops below -100, it suggests that the asset may be oversold and due for a rebound. This can provide a potential buying opportunity, especially in conjunction with other technical signals.
Pro Tip: The overbought/oversold zones are most useful when markets are ranging, as assets tend to oscillate between these levels during such times.
📍 2. Spotting Trend Strength and Continuation
In trending markets, the CCI can act as a trend-following indicator:
Above +100 (in a strong trend): When the CCI crosses above +100 and stays there, it can indicate that the trend has momentum. Traders might consider adding to positions rather than exiting.
Below -100 (in a strong downtrend): Similarly, if the CCI stays below -100 during a downtrend, it can confirm the strength of the downtrend, potentially encouraging traders to hold onto short positions longer.
Pro Tip: Instead of using CCI solely for overbought/oversold signals, use it to confirm whether a trend has enough strength to continue. Combine it with moving averages or trendlines for a clearer picture.
📍 3. Identifying Divergences
One of the most valuable aspects of the CCI is its ability to signal divergences between price action and momentum. These divergences often precede reversals, offering traders early entry signals:
Bullish Divergence: This occurs when the price makes a new low, but the CCI makes a higher low. It signals that downward momentum is weakening, and a reversal to the upside may be imminent.
Bearish Divergence: This happens when the price makes a new high, but the CCI makes a lower high. It signals that upward momentum is fading, and a reversal to the downside could occur soon.
Pro Tip: Divergences are most effective when combined with other forms of technical analysis, like support/resistance levels or candlestick patterns.
🧠 How to Integrate CCI into Your Trading Strategy
The CCI is a versatile indicator that can be used in various trading strategies depending on your trading style. Let’s explore a couple of approaches.
1. The Reversal Strategy
This strategy works best in ranging markets, where price oscillates between support and resistance levels.
Buy Signal: Look for the CCI to drop below -100 (oversold) and then cross back above it, signaling potential upward momentum. Combine this with other confirmation indicators such as support levels or bullish candlestick patterns.
Sell Signal: Look for the CCI to rise above +100 (overbought) and then cross below it. This could be your cue to take profits or enter a short position, especially if price resistance is nearby.
2. The Trend-Following Strategy
In trending markets, the CCI helps you identify strong momentum moves.
Buy Signal: If the CCI crosses above +100 and the market is in a confirmed uptrend, use this as a signal to enter long positions. The CCI helps confirm that the trend has enough strength to continue.

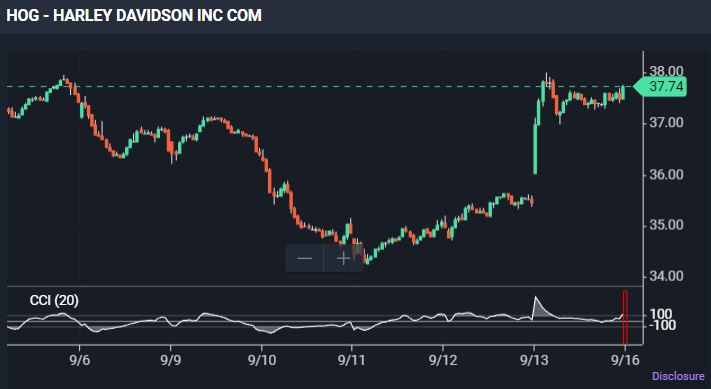
CCI crossed above -100% on 9/13 telling us the price is exceedingly higher than the 20-bar average. This bullish event is typically a sign to consider long positions anticipating the price will continue to rise. Be aware that this can also be considered "overbought" so watch for signs of reversal.
Sell Signal: If the CCI falls below -100 in a confirmed downtrend, use it as confirmation to enter or hold onto short positions.
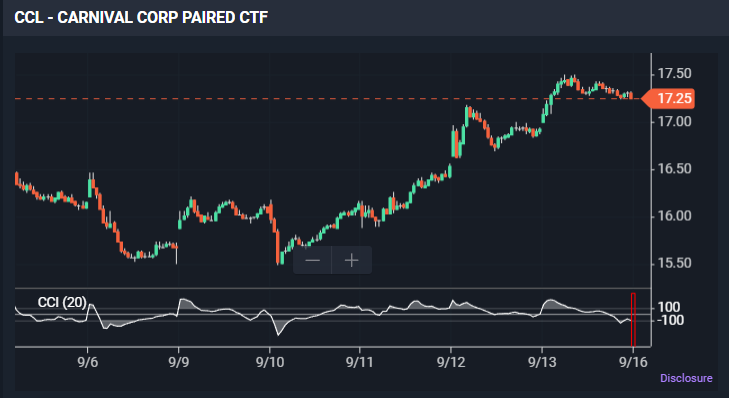
CCI crossed below -100% on 9/13 telling us the price is exceedingly lower than the 20-bar average. This bearish event is typically a sign to consider short positions anticipating the price will continue to decline. Be aware that this can also be considered "oversold" so watch for signs of reversal.
Pro Tip: Combine the CCI with a moving average crossover or trendline break to further validate your entries and exits.
🔑 Key Takeaways: Why You Should Use CCI
Versatility: It works across asset classes (not just commodities) and in both trending and ranging markets.
Momentum Tracking: The CCI is great for spotting trend strength, reversals, and continuations.
Divergences: Bullish and bearish divergences give early warning signals for potential reversals.
Flexibility: It can be used to both find overbought/oversold conditions and confirm trend strength, making it a valuable addition to any trader’s toolkit.
📝 My Take
The Commodity Channel Index is one of the most underutilized but highly effective tools in technical analysis. Whether you’re a swing trader looking for reversals or a trend trader seeking to confirm momentum, the CCI can provide you with valuable insight. Like any indicator, it works best when combined with other tools, but its ability to highlight overbought/oversold conditions and divergences makes it stand out. Happy Trading! 🚀-ec
*Disclaimer The information in The Options Oracle is my opinion, not financial advice.
Looking For More Trade Ideas? Follow Me on Twitter / X at EdwardCoronaUSA
Next time you’re evaluating a stock, try adding the CCI to your chart. You might find that it gives you a clearer picture of the underlying momentum—and who doesn’t want that edge?
Feel free to comment below or shoot me a message if you have any questions about how to apply the CCI to your trading strategy. Let’s keep the conversation going! 👇