


💥 UNH Just Nuked the Dow – Here’s the Breakdown
📉 UnitedHealth’s Worst Trading Day in Decades Deserves a Closer Look

Hey traders and investors,
When a single stock knocks nearly 700 points off the Dow, I pay attention. And that’s exactly what happened with $UNH after it reported a brutal Q1 earnings miss and slashed its FY25 guidance. This wasn’t just a miss — it was a full-on rug pull.
As someone who trades based on technical setups but always keeps an eye on the fundamentals that move price, I had to dig into this one for you.
Let’s break it all down — what happened, what the chart is telling us now, and whether there’s even a trade to be made here.
🩻 What the Heck Happened?
UnitedHealth ($UNH) was ripping higher coming into earnings — up 33% from its lows in just under two months. The rally was strong and sharp, fueled in part by optimism after a DOJ billing investigation in February didn’t deliver a knockout blow.
But then came Q1:
Revenue: $109.6B (+9.8% YoY) — missed
EPS: $7.20 — missed
Guidance Slashed: FY25 EPS now $26.00–$26.50, down from $29.50–$30.00
That’s a massive revision.
CEO Andrew Witty cited two main issues:
Medicare Advantage (MA) care activity was double what they projected, especially in outpatient services.
A big influx of less-engaged Optum Medicare patients — many coming from plans that left the market — led to weaker reimbursement and revenue expectations.
And don’t forget the CMS risk model changes and Medicare cuts from the Biden administration adding even more complexity to their forward outlook.
Translation? Rising medical costs, operational issues, and slower adaptation to CMS reforms = no quick fix. They’re not even looking for a bounce in 2025. Management basically said: "See you in 2026."
So yeah… the market punished them.
🧠 Chart Analysis — Step-by-Step
Let’s walk through the chart together.
🔍 The Breakdown:
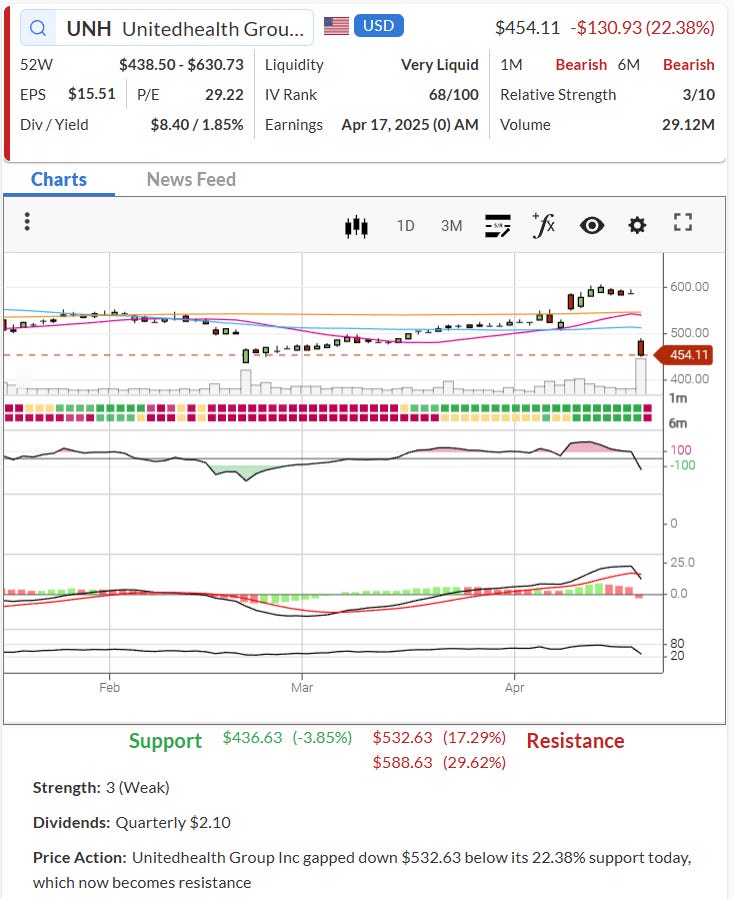
Price Action: UNH gapped hard below $532.63 support and landed at $454.11 — a 22.38% crash. That $532.63 level now flips into resistance.
Support Zone: We’ve got weak support at $436.63. That’s the only nearby line in the sand. If that breaks, it’s open air below.
Volume Spike: The highest daily volume in over a year — this wasn’t a small reaction. Funds were exiting the trade in size.
Momentum Indicators: The MACD just curled over after a bearish crossover, and the histogram bars are gaining to the downside.
RSI: Dropping fast but not quite yet in oversold territory. So there could still be a little more downside room.
🔨 Structure and Setup
Before this earnings disaster, UNH was riding a clean uptrend. 20-day, 50-day, and 200-day moving averages were all stacked bullishly. That’s gone now. Price sliced through every moving average in one session. That is not normal — it’s institutional unloading.
And that’s key: This was institutional liquidation, not just retail panic.
💡 So… Is There a Trade Here?
Let me be blunt: Not yet.
This is a situation where I’d rather be late than early. Catching falling knives is not my thing — and this knife is still in mid-air.
Here’s how I’m thinking about it:
🧭 Investor Play
If you’re a long-term investor thinking about averaging down, I’d wait for stability:
Watch how it behaves around $436.63
Look for consolidation and volume tapering
A weekly close back above $470–$480 with support holding could indicate the worst is priced in
But until UNH proves it can manage costs, adapt to CMS changes, and regain revenue visibility — it’s a “wait and see” in my book.
🔁 Trader Play
If you’re an active trader, there might be a quick bounce trade down the road:
If $436 holds, a dead cat bounce toward $470–$490 is possible, especially if shorts cover
That said, I’d only look to short into strength near $500–$510 if it stalls out under that flipped resistance ($532)
But I wouldn’t open a position immediately after a move like this. Let it breathe. Let the chart set up again.
🧾 Conclusion: Sometimes the Best Trade Is No Trade
Look — not every major move is an opportunity. Sometimes the play is just to study the damage, understand what triggered it, and watch what develops. That’s where I’m at with $UNH.
It cratered because the story changed dramatically. Institutional buyers fled, and until we see real signs of a bottom — like sideways price action, bullish divergence, or some fundamental clarity — it’s smarter to keep this one on a watchlist instead of in your portfolio.
But I’ll say this: when big names collapse like this, opportunity often shows up later, not right away.
If I decide to trade this, I’ll let my paid subs know with a detailed plan.
Talk soon,
— EC 👊
📬 Want Setups Like This Delivered To You Daily?
If this breakdown helped you and you want more like it — high-probability trade setups, technical analysis, entry zones, and trade management updates — I deliver it all straight to your inbox every market day. Consider becoming a paid subscriber to The Options Oracle.
🔒 Upgrade to a paid subscription here
*Disclaimer: The examples in The Options Oracle are my opinion, not financial advice.
I am so glad I read this post and stay away. Thank you. But now that it’s 280, is it qualified to start adding some?