
🔍 Weekend Deep Dive: NVIDIA $NVDA – Back in the Spotlight
Mapping Out the Trade: Levels, Signals, and Strategy on $NVDA

Hey traders and investors,
Let’s talk about a name that doesn’t stay out of the headlines for long: NVIDIA. After delivering another blockbuster earnings report on Wednesday (May 28), this AI chip juggernaut lit up the tape again — and honestly, I couldn’t not break this one down for the weekend.
What caught my attention wasn’t just the beat on earnings and revenue (although $44.06 billion in a single quarter is no joke). It was the fact that, despite export restrictions gutting its H20 product sales in China, NVIDIA’s Data Center business still posted a jaw-dropping $39.1 billion, up 73% year-over-year. That’s absurd strength.
Between the ongoing Blackwell ramp (their fastest product rollout ever), the rising inference demand from giants like OpenAI and Microsoft, and gamers/creators snatching up AI PCs, this thing is firing on all cylinders.
But now that the dust from the earnings hype is settling, let’s get to what really matters: the chart.
📊 Technical Breakdown
🟢 Trend: Still Bullish, With a Caveat
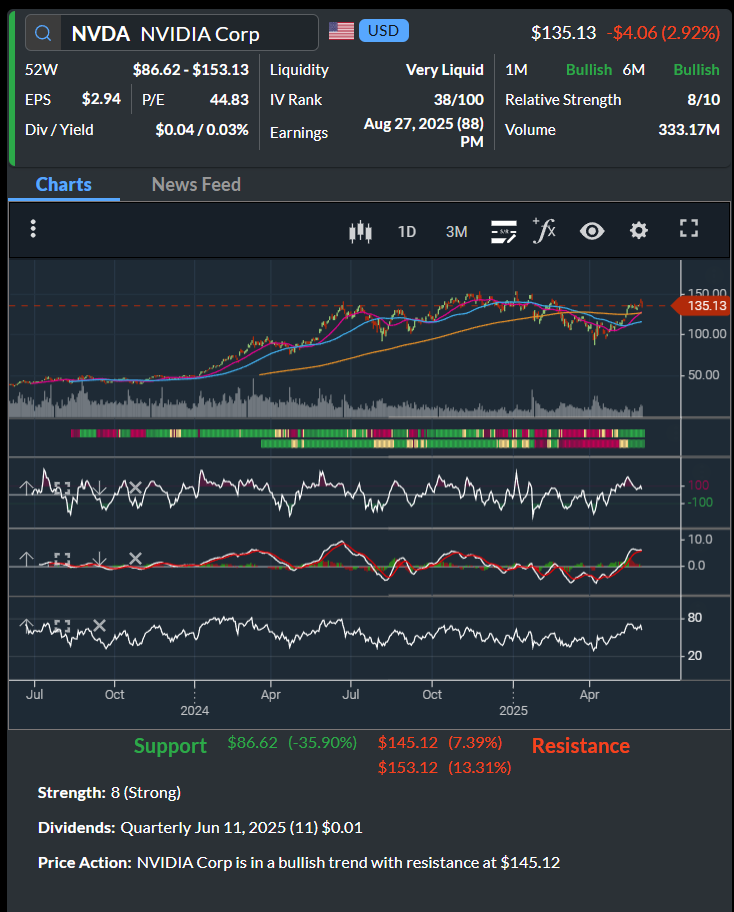
Let’s walk through the chart. Price is currently at $135.13, which puts it near the top of its 52-week range ($86.62 – $153.13). That’s bullish, and the short- and medium-term trend lines confirm it — but there are some key levels you’ll want to watch.
We’ve had a pullback of 2.92% on Friday, but don’t read too much into it. That red day looks like a healthy breather after a big move up. What matters more is where price stands relative to support, resistance, and moving averages.
📈 Moving Averages (MA)
Red Line (20-day MA): Riding just under current price, acting like a trampoline — good sign for continued strength.
Blue Line (50-day MA): It’s sloping upward and sits well below price, signaling a medium-term uptrend.
Orange Line (200-day MA): Far below, confirming the long-term uptrend is intact.
What I’m watching: The fact that price is above all 3 moving averages tells me momentum is still on the side of the bulls. If we pull back toward the 20-day MA and bounce? That’s a textbook buy-the-dip opportunity.
🔴 Resistance and Support
Major Resistance Levels:
$145.12 (short-term ceiling — the market has memory here)
$153.12 (52-week high)
Support Zones:
$135 (right here — former breakout level acting as support)
$120 (psychological level and prior congestion zone)
$86.62 (major long-term support, but let’s hope it doesn’t come to that)
We’re currently hugging $135 — this could be a make-or-break spot. If it holds here and we push through $145, there’s a clean runway to retest highs.
📉 Indicators Breakdown
✅ RSI (Relative Strength Index)
RSI is floating around 65, not yet overbought but definitely pushing it. That tells me there’s still juice left in this move — but I’m also watching for any signs of divergence (price moving up while RSI stalls out), which could warn of a stall or reversal.
✅ MACD (Moving Average Convergence Divergence)
The MACD line is above the signal line and both are in positive territory — that’s a bullish momentum setup. Histogram bars are expanding, meaning strength is increasing. Think of this like the engine revving — we’re not coasting, we’re accelerating.
💼 How I’d Play It
This one depends on whether you’re a trader or an investor — so here’s how I’d look at both:
For Short-Term Traders:
Entry: Around $135-137 on confirmation of support (watch for a bounce off 20-day MA)
Stop: Tight under $130 — that’s where structure breaks
Target: $145 for partial, $153 for full
This is a momentum trade. You're looking to ride that wave of AI optimism and institutional buying. Keep it tight — in and out.
For Long-Term Investors:
Ideal Entry: Add on dips around $130 or even better if it tags the 50-day ($120-ish)
Hold Target: You’re not selling at $145 or $153 — that’s just the next leg. If the AI build-out thesis holds, this name could be looking at new all-time highs within 6–12 months.
Stop? Only if thesis breaks. That would mean a major unexpected shift in AI spending or regulatory headwinds worsening.
If you believe AI is here to stay (and let’s face it — it’s not going anywhere), then NVIDIA is arguably the king of the hill.
🔚 Wrapping It Up
There’s a reason this stock was front and center this week. Yes, the China export issue is real — but Data Center strength and Blackwell demand more than make up for it. The technical setup is strong, momentum is real, and this dip off earnings highs might be your second chance to get in.
Whether you're riding the trend short term or building a position long term, NVIDIA deserves your attention right now.
I'll be watching for confirmation at the $135 level — and if we get that bounce, I’m leaning long.
Let me know how you're playing $NVDA in the comments 👇
If you want daily trade setups, market commentary, and chart breakdowns like this, consider becoming a paid subscriber to The Options Oracle.
📬 Upgrade to a paid subscription here and start trading with an edge.
Remember, I also post a free morning briefing before the open and a closing summary every day on Substack Notes and X — turn on notifications so you don’t miss them!
*Disclaimer: The examples in The Options Oracle are my opinion, not financial advice.
Great analysis, thank you, Edward!
You might want to take a look at MP – – MP materials. It’s a tiny bit early on the outstanding chart and all of the indicators are pointing in the right direction.
Take my friend,
William
We’re back baby