


🧠 Weekend Technical Deep Dive: Alphabet Inc. (GOOG)
Why Alphabet Got Smacked on Friday — and What the Chart’s Telling Me Now

Hey traders and investors,
Let’s get into $GOOG.
Alphabet got hit hard Friday, closing down -3.59%, dragging both Class C ($GOOG) and Class A ($GOOGL) shares with it. While the market as a whole was barely down, Alphabet saw some real heat — and this time it wasn’t earnings, AI hype, or some analyst downgrade. It was legal drama out of Europe, and it packed a punch.
So what happened?
Alphabet’s been fighting a long-running antitrust case over Android. The EU hit them with a massive fine years ago — over €4.3 billion — for allegedly forcing manufacturers into pushing Google Search and Chrome through Android. Alphabet appealed.
But on Friday, the top advisor to the European Union’s highest court, Advocate-General Juliane Kokott, recommended tossing that appeal. Her language was blunt: Google held a dominant position and used network effects to make sure users stayed on Google Search. The court usually follows her recommendations. So now, that €4.3 billion fine is likely sticking — trimmed slightly to €4.1B ($4.7B USD), but still hefty.
For a company the size of Alphabet, that’s not a financial problem. But it’s a regulatory overhang, and investors hate that — especially when it’s not the first time. This case just reinforces that Alphabet’s dominance is still a legal target in Europe (and possibly beyond).
Alright — now let’s talk about what really matters to us: the chart.
🔍 Chart Breakdown: Price, Trend, and Momentum
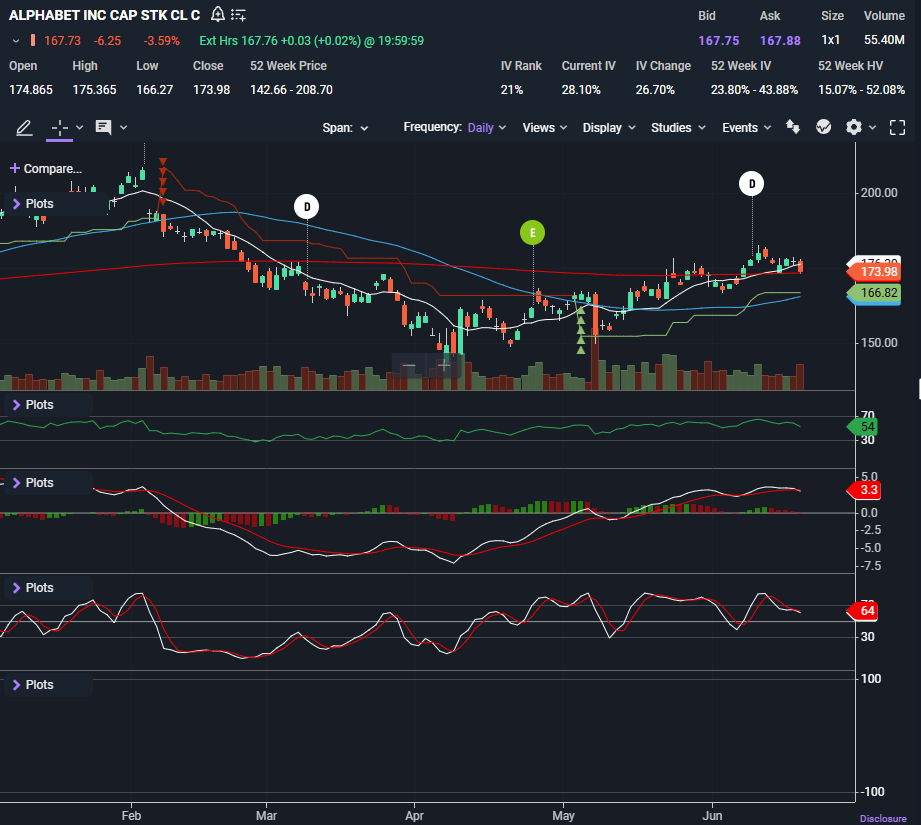
Friday’s close landed $GOOG at $167.73, a sharp drop that erased two weeks of slow upward progress. But what makes this technical setup so interesting is where that drop happened — and what it lines up with.
📉 Price Action
Price had been working its way higher off an April low near $150, building higher highs and higher lows.
But on Thursday, it tapped into overhead resistance right around $173.98–$174, just below the recent local high near $178.49, and promptly reversed.
Friday’s selloff sent it tumbling right back into the $166–$167 zone, where it’s now testing support from early June consolidation and the 50-day moving average.
The support zone is now:
$166.27 (price low from Friday)
Followed by major longer-term support at $142.49 (-15.05%)
Resistance above is still clean:
$171.49, where recent rejection occurred
$178.49, which would be the breakout target if buyers step in
🧠 Moving Averages
The 50-day moving average is slightly below price, around $166.82, and looks like it could act as short-term support — it’s been respected before.
The 200-day moving average is still rising but much lower, somewhere around $154, untouched since Alphabet rallied back in April.
If price breaks below that 50-day and closes under it, I’d start watching for a deeper pullback toward that $160–$154 range.
📊 Volume
Look at that volume spike on Friday — 55.40M shares traded, far higher than the average of the prior few sessions. That’s not just some fade — that’s institutional-sized activity stepping in on news.
This wasn’t a soft rejection. It was a hard stop at resistance, with sellers jumping in fast.
💪 RSI (Relative Strength Index)
RSI is sitting at 54, which tells us one thing: we’re in neutral territory. It’s not oversold. Not overbought. There’s room for a move either direction, and it’ll likely depend on how price handles the 50-day moving average in the early part of the week.
🔻 MACD
MACD has been turning over for a few days. The histogram is shrinking, and the MACD line looks like it’s about to cross below the signal line — that would be a bearish crossover, confirming a possible trend shift.
That’s momentum rolling over, not accelerating.
🔄 Stochastics
The Stochastics oscillator is rolling over too — currently around 64, curling downward. Again, not in oversold territory yet, but it’s pointing lower.
Taken together with MACD and price rejection at resistance, this confirms the momentum is cooling off.
🧭 How I’d Trade It
Here’s how I’d approach this from two perspectives: short-term position trader and long-term investor.
Keep reading with a 7-day free trial
Subscribe to The Options Oracle to keep reading this post and get 7 days of free access to the full post archives.